Figure 6.
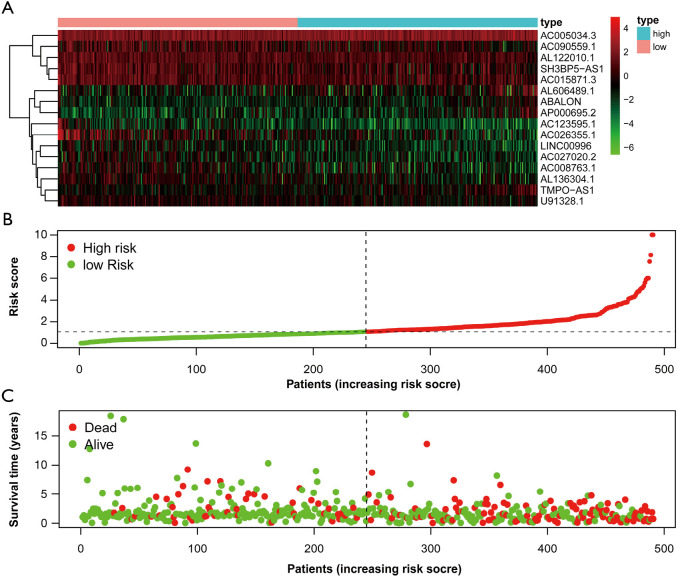
Autophagy-related lncRNA risk score analysis of LUAD patients. (A) Heatmap showed the expression profiles of autophagy-related lncRNAs in the low-risk and high-risk groups; (B) the risk curve based on the risk score of each sample; (C) the scatterplot based on the survival status of each sample. LUAD, lung adenocarcinoma.

