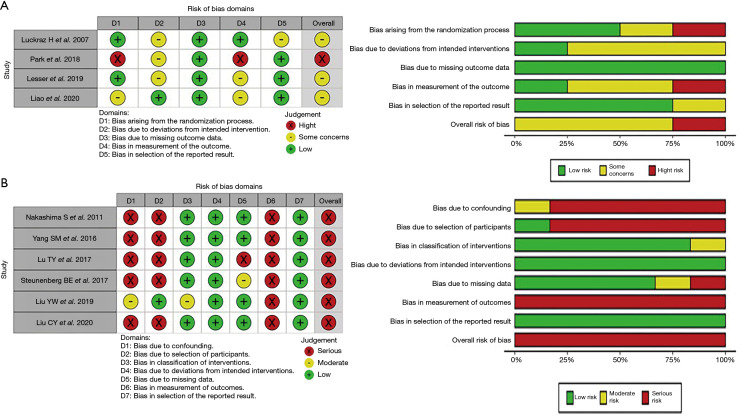
Figure 2.
Graph of the risk of bias summary for (A) included randomized controlled trials using RoB 2 tool; (B) included observational studies using ROBINS-I tool. RoB 2 tool evaluates five domains “randomization process”, “deviations from intended intervention”, “missing data”, “measurement”, “selection of the reported result”. ROBINS-I tool evaluates seven domains “confounding”, “selection of participants”, “classification of interventions”, “deviations from intended interventions”, “missing data”, “measurement”, “selection of the reported result”. All domains and overall results are judged as “low”, “some concerns” or “moderate”, “high” or “serious/critical” risk of bias.

