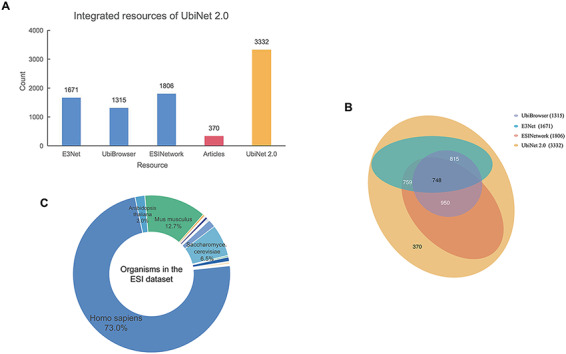
Figure 2.

Integrated resources of UbiNet 2.0. (A) The numbers of ESIs collected from three other platforms, literature as well as UbiNet 2.0. (B) The Venn diagram on the resources. It shows the overlap of ESI records between the resources. The numbers in the brackets beside the database names are the total number of ESIs in the corresponding database. (C) Organisms involved in the ESI data set of UbiNet 2.0.
