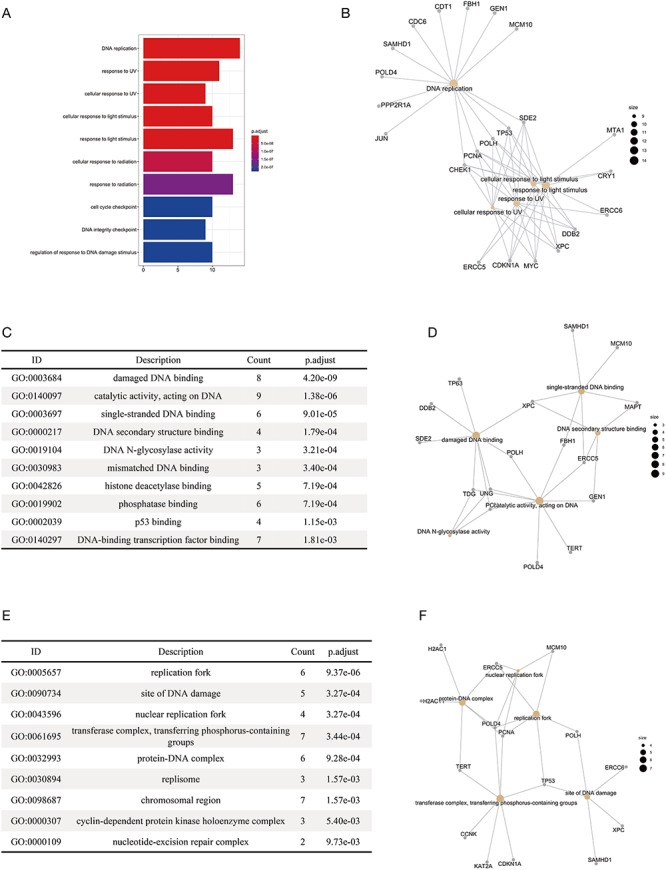
Figure 4.

The results of the functional enrichment analyses on the substrates of DCX E3 ligases. (A) The bar chart shows the enriched biological processes of the substrates of DCX E3s. (B) The network between the substrates of DCX E3s and the enriched biological processes. The yellow circles represent the functional terms, while the gray circles represent the substrates. The size of the yellow circles indicates the number of substrates associated with that functional term. (C) The bar chart illustrates the enriched molecular functions of the substrates of DCX E3s. (D) The network between the substrates of DCX E3s and the enriched molecular functions. (E) The enriched cellular compartments of the substrates of DCX E3s are listed. (F) The network between the substrates of DCX E3s and enriched cellular compartments.
