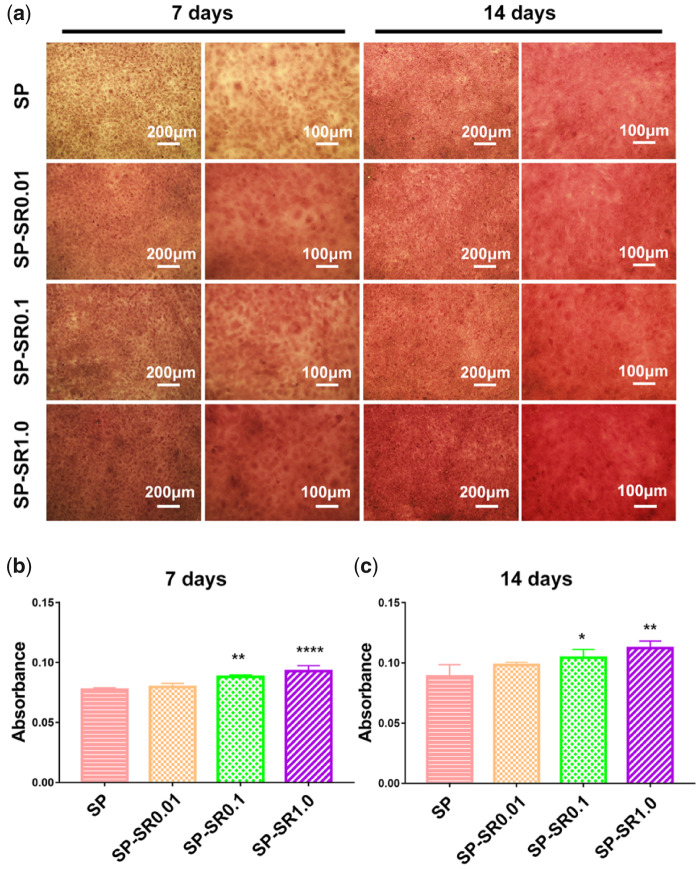
Figure 7.
ECM mineralization deposition of the MC3T3-E1 cell cultured on various sample surfaces for 7 and 14 days at low and high magnifications (a); quantitative analysis for 7 days (b); and 14 days (c). (*P < 0.05, **P < 0.01, ****P < 0.0001. All the data are expressed as the means ± SD and n = 3)

