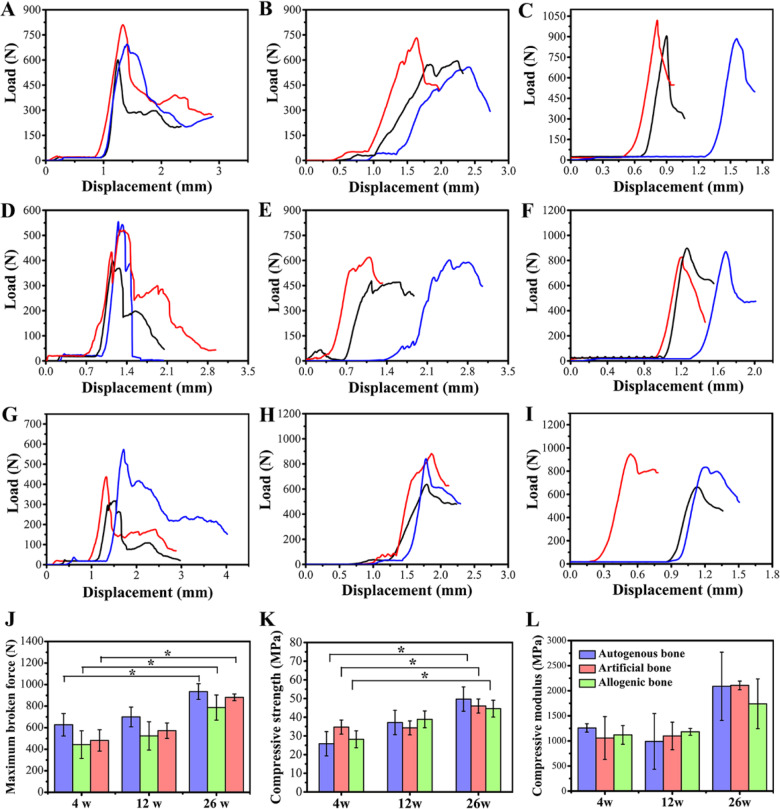
Figure 5.
Compression test of femur in animals of different groups. (A−C) The change of load with displacement of autogenous bone at 4, 12 and 26 weeks. (D−F) The change of load with displacement of artificial bone at 4, 12 and 26 weeks. (G−I) The change of load with displacement of allograft bone at 4, 12 and 26 weeks. (J) Maximum broken force derived from the curve of compression test. (K) Statistical analysis of changes in femoral compressive strength of animals in each group. (L) Statistical analysis of changes in femoral compressive modulus of animals in each group. Data were presented as mean ± SD by t-test (n = 3). *P < 0.05

