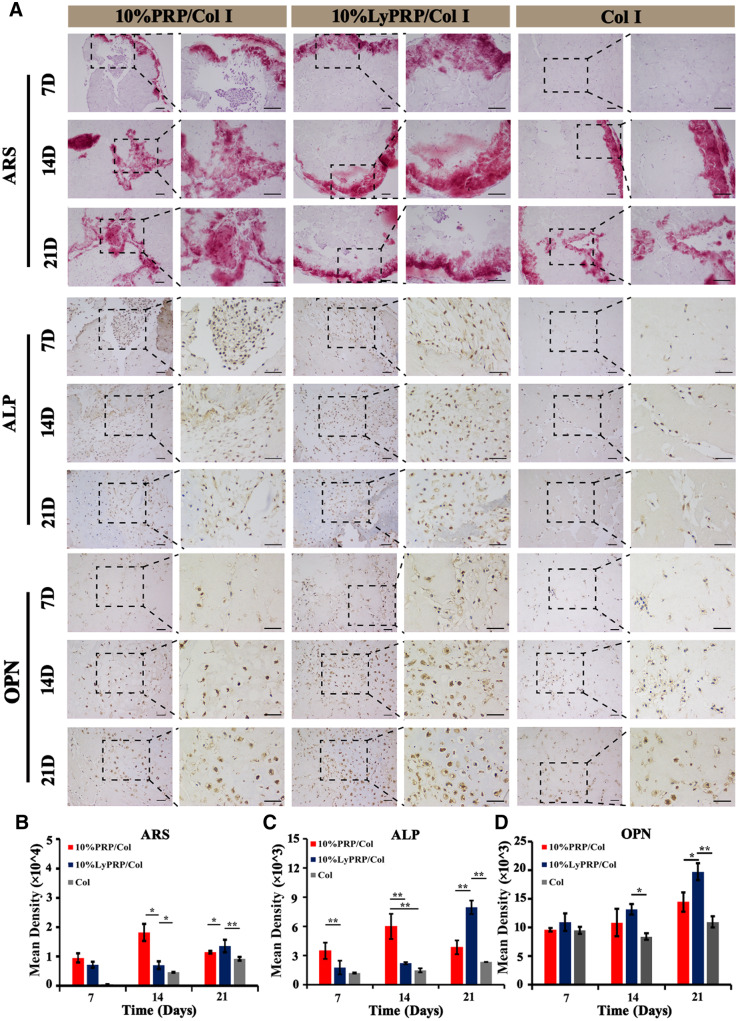
Figure 6.
(A) ARS, ALP and OPN staining images of cell-hydrogel constructs at 7, 14 and 21 days. The dashed boxes are the corresponding high magnification images. Scale bars represent 100 μm. Semi-quantitative analysis of (B) ARS, (C) ALP and (D) OPN staining results. The data were presented as mean ± SD from three independent experiments (n = 3). ∗P < 0.05, ∗∗P < 0.01 and ∗∗∗P < 0.001.

