Figure 2.
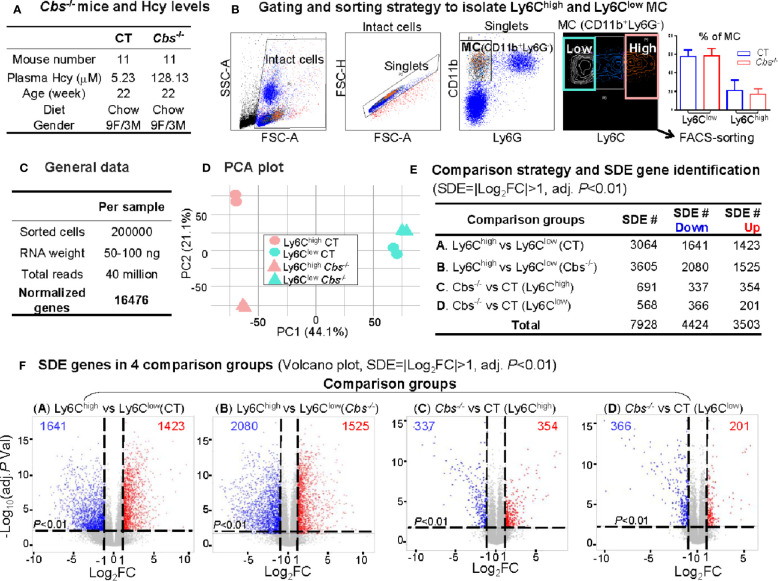
RNA-Seq analysis and SDE gene identification from blood Ly6Chigh and Ly6Clow MC of C57/BL6 control and Cbs -/- mice. (A) Cbs -/- mice and Hcy levels. Eleven mice were used in each group. Severe HHcy were determined in Cbs -/- mice (plasma Hcy 128.13 μmol/L). (B) Gating and sorting strategy to isolate Ly6Chigh and Ly6Clow MC. Mouse white blood cell were prepared from peripheral blood and stained with antibody against CD11b, Ly6G and Ly6C and subjected for flow cytometry cell sorting. Intact cells (72.8%) were recognized based on higher FSC-A (larger size). Singlets (71.0%) were identified by using FSC-H versus FSC-A appeared on a diagonal. CD11b+Ly6G- cells (11.0%) were selected as MC. MC subsets (CD11b+Ly6G-Ly6Chigh, and CD11b+Ly6G-Ly6Clow) were sorted based on Ly6C levels. The quantification of MC was used flow cytometry analysis for Ly6Chigh and Ly6Clow MC in CT and Cbs-/-. (C) General data. 100 ng mRNA were obtained from 100,000 sorted cells and achieved around 30 million reads and 16,487 normalized genes per sample by mRNA-Seq analysis. (D) PCA plot. PCA analysis incorporated 8 samples from 4 groups of MC subsets {Ly6Chigh (CT), Ly6Clow (CT), Ly6Chigh (Cbs-/-) and Ly6Clow (Cbs-/-), n=2} using the R software package Seurat. PC1 versus PC2 demonstrates the close transcriptional proximity. PC1, PC2 and PC3 variance is 44.1%, 21.1% and 12.9%. PC1 (44.1%) means that the difference on the x-axis can explain 44.1% of the overall result. (E) Comparison strategy and SDE gene identification. We performed four group comparison (A–D) and identified down-regulated and up-regulated SDE genes using the criteria of |Log2FC| more than 1 (2-FC) and adjusted P value less than 0.01. (F) SDE genes in four comparison groups. Volcano plot of all genes demonstrates the expression pattern of SDE genes in four comparison groups. Down-regulated SDE genes are highlighted in green and up-regulated in red (|Log2FC|>1, adj. P<0.01), with Log2FC as x-axis and −Log10(adjust P-value) as y-axis. MC, monocyte; CT, control; Cbs, cystathionine β-synthase; HHcy, Hyperhomocysteinemia; Hcy, homocysteine; FACS, fluorescent-activated cell sorting; PCA, principal component analysis; PC, principal component; SDE, significantly differentially expressed; FC, fold change.

