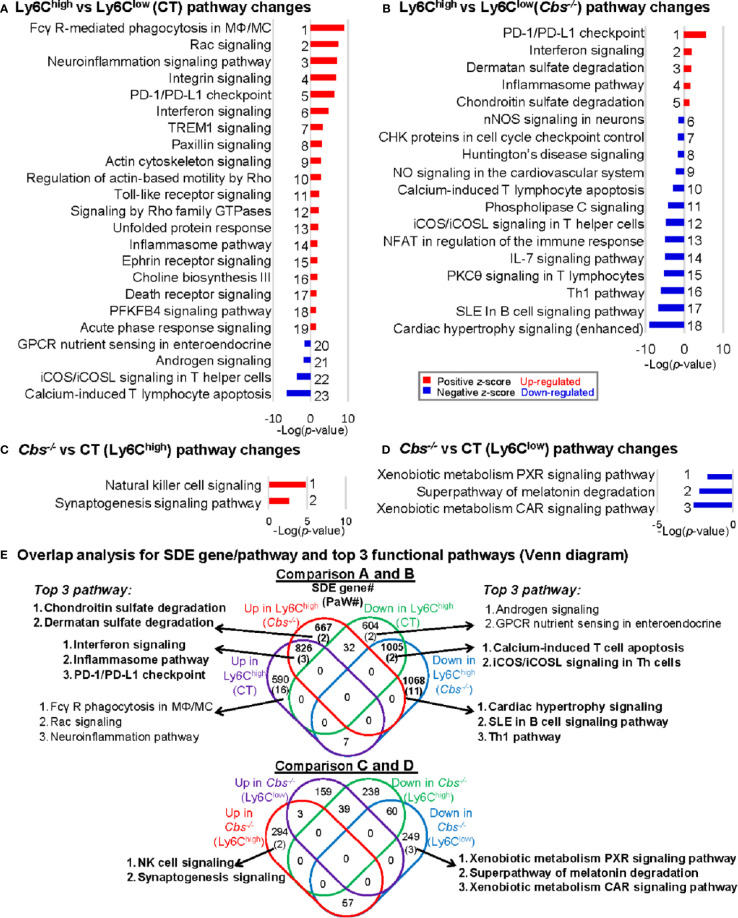
Figure 3.
General canonical pathway analysis for SDE genes from four comparison groups. (A) Ly6Chigh vs. Ly6Clow (CT) pathway changes; (B) Ly6Chigh vs. Ly6Clow (Cbs-/-) pathway changes; (C) Cbs-/- vs. CT (Ly6Chigh) pathway changes; (D) Cbs-/- vs. CT (Ly6Clow) pathway changes. Top canonical pathways were identified by top-down analysis using IPA software. Significant top IPA pathways are identified using the criteria of adjusted P value<0.05 and |Z-score|>2. Blue bar indicates a negative z-score and down-regulated pathway. Red bar indicates a positive z-score and up-regulated pathway. Representative top 40 up/down SDE genes involved in these top pathways are listed in Supplementary Table 1 . (E) Overlap analysis for SDE genes in Ly6C MC subsets and top 3 functional pathways (Venn diagram). Venn diagram summarized the total SDE genes and their top 3 pathways in each SDE set in four pairs of comparisons. Numbers depict the amount of SDE genes. Numbers in the parentheses describes the number of pathways. MC, monocyte; MΦ, macrophage; TREM1, The triggering receptor expressed on myeloid cells 1; GPCRs, G-protein-coupled receptors; PFKFB4, 6-phosphofructo-2-kinase/fructose-2,6-biphosphatase 4; SLE, Systemic Lupus Erythematosus, Th1, T helper 1; PKCθ, Protein Kinase C Theta; IL-7, Interleukin 7; NFAT, Nuclear factor of activated T-cells; CHK, Csk-homologous kinase; nNOS, neuronal nitric oxide synthase; PXR, pregnane X receptor; CAR, constitutive androstane receptor.

