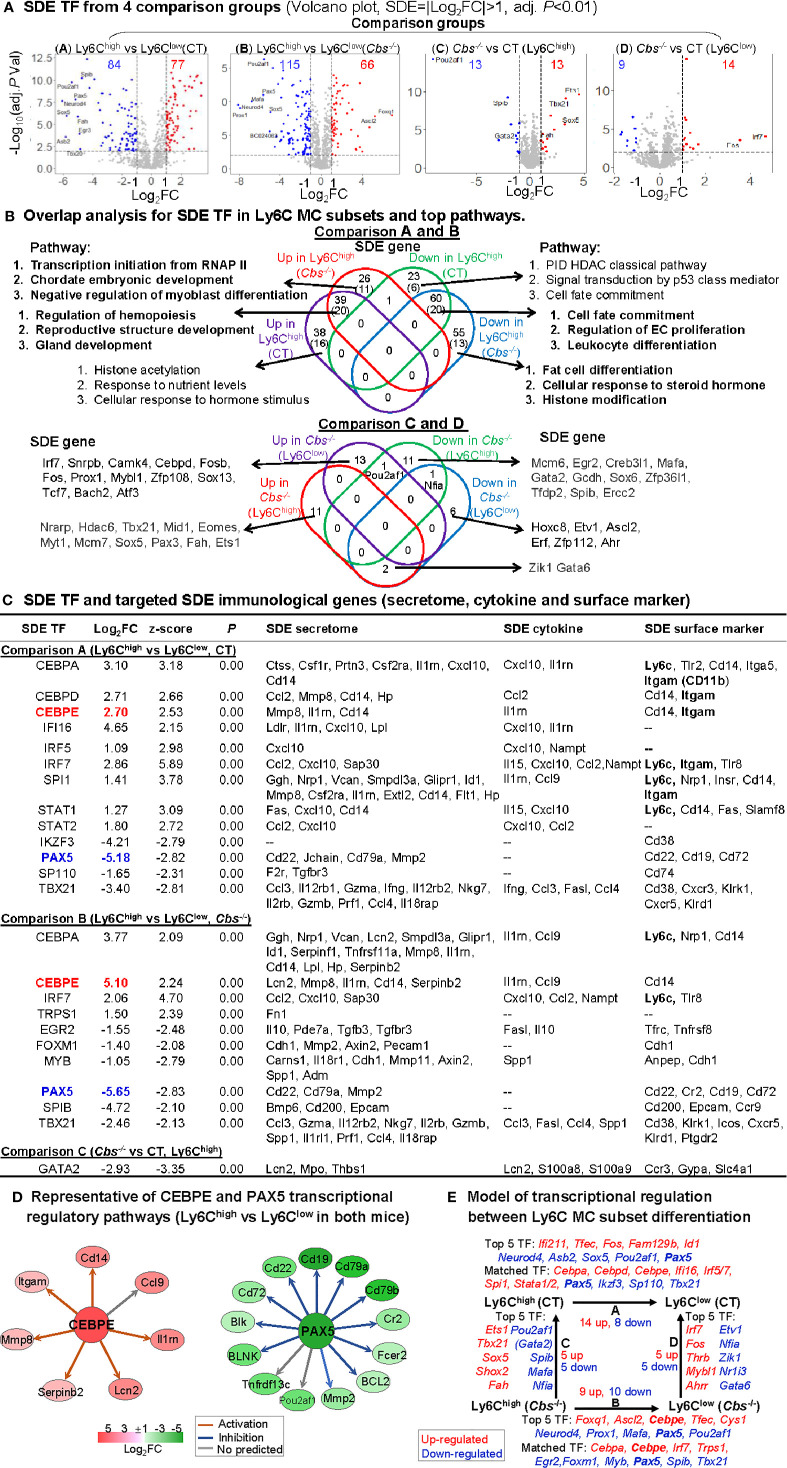
Figure 5.
Identification of SDE TF and immunological transcriptional regulatory models. (A) SDE TF in four comparison groups. Volcano plot of all genes demonstrates the expression pattern of SDE TF in four comparison groups. Down-regulated SDE TF are highlighted in green and up-regulated in red (|Log2FC|>1, adj. P<0.01), with Log2FC as x-axis and −Log10(adjust P-value) as y-axis. Top 25 up- and down-regulated SDE TF in all comparisons via IPA are listed in Supplementary Table 2 . (B) Overlap analysis for SDE TF in Ly6C MC subsets and top pathways. Venn diagram summarized the total SDE genes and their top 3 pathways in each SDE TF change groups from four pairs of comparisons. Functional pathways were developed by metascape software using the GO database only in SDE set (>20 SDE genes). The top 3 functional pathways are presented. Numbers depict the amount of SDE TF. Numbers in the parentheses describes the number of pathways. A detailed list of SDE TF and pathway in each SDE set are presented in Supplementary Table 3 . (C) SDE TF and targeted SDE immunological genes. SDE immunological genes were matched with SDE TF by IPA upstream analysis. Transcriptional regulatory relationship between SDE TF and SDE immunological genes was justified by correspondence at the same direction (either positive or negative) and overlapped p-value<0.01 and |z-score|>2. Note that Itgam is also known as CD11b, that Ly6c refers to other Ly6 genes (Ly6.2, Ly6C, Ly6C.2, Ly6C antigen, Ly6a2, Ly6al, Ly6b, Ly6c1, Ly6c2, Ly6f, Ly6g, Ly6i). (D) Representative of CEBPE and PAX5 transcriptional regulatory pathways (Ly6Chigh vs. Ly6Clow in both mice) CEBPE and PAX5 are used as the representative SDE TF to establish transcriptional regulatory network by using IPA upstream analysis. The corresponding expression levels of targeted SDE genes are indicated by colored nodes. (E) Model of transcriptional regulation between Ly6C MC subset differentiation. Model describes potential transcriptional regulatory machinery. In Comparison A, 22 SDE TF (14 up-red and 8 down-blue) are identified in Ly6Chigh MC subset in CT mice. In Comparison B, 19 SDE TF (nine up and 10 down) are identified in Cbs-/- Ly6Chigh MC subset. In Comparison C, 10 SDE TF (five up and five down) are identified in Cbs-/- Ly6Chigh MC subset. While, in Comparison D, 10 SDE TF (five up and five down) are identified in Cbs-/- Ly6Clow MC subset. Top 5 SDE TF are indicated in italic letters, and matched SDE TF in the parentheses. Red letter highlighted the representative up-regulated gene. Blue letter highlighted down-regulated genes. Abbreviations are as that in Figure 2 . RNAP, RNA polymerase, PID, pathway interaction database; HDAC, histone deacetylase. Abbreviation for gene names refer to list in website, https://www.genecards.org/.

