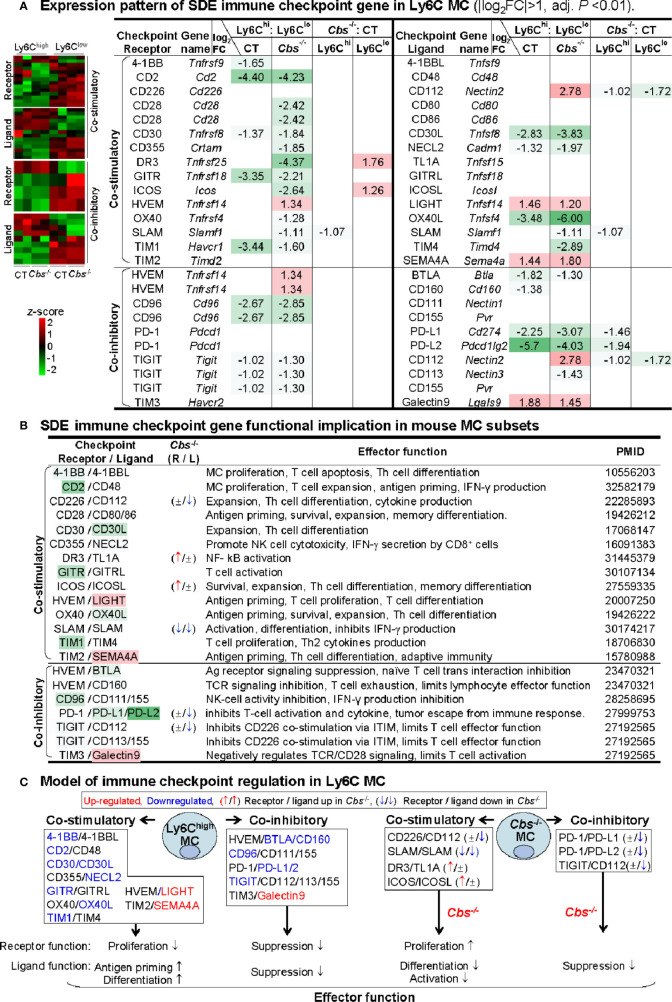
Figure 6.
Identification of SDE immune checkpoint gene and function implication in Ly6C MC. (A) Expression pattern of SDE immune checkpoint gene in Ly6C MC. Heatmap shows the expression levels of the immune checkpoint gene (receptor and ligand) in Ly6C MC. The color density indicates the average expression of a given gene normalized by z-score. Fifteen pairs of SDE co-stimulatory and 10 pairs of SDE co-inhibitory molecules are identified in four comparison groups. Red-colored background numbers indicate FC>2 (log2FC>1). Green-colored background numbers indicate FC<0.5 (log2FC<-1). The completed list of Immune checkpoint genes is in Supplementary Table 4 . (B) SDE immune checkpoint gene functional implication in mouse MC subsets. This table describes expression pattern and effector function of SDE immune checkpoint (ligand-receptor) in Cbs -/- Ly6C MC. (C) Model of immune checkpoint regulation in Ly6C MC and Cbs -/- mice. In Ly6Chigh MC, downregulation of co-stimulatory receptor molecules implicates suppressed proliferation and upregulation of ligand molecules implicates increased antigen priming and differentiation. Co-inhibitory molecule change support similar biologic function. Cbs -/- MC presented feature of increased receptor cell proliferation and deceased ligand cell differentiation/activation. Upregulated SDE immune checkpoint molecules are marked in red, downregulated in blue. ↑ refers to induce expression by Cbs -/-. ↓ refers to reduce expression by Cbs -/-, ± refers to no changes in Cbs -/-. NK, natural killer cells; TCR, T-cell receptor; ITIM, immunoreceptor tyrosine-based inhibition motif; Other abbreviations are as that in Figure 2 .

