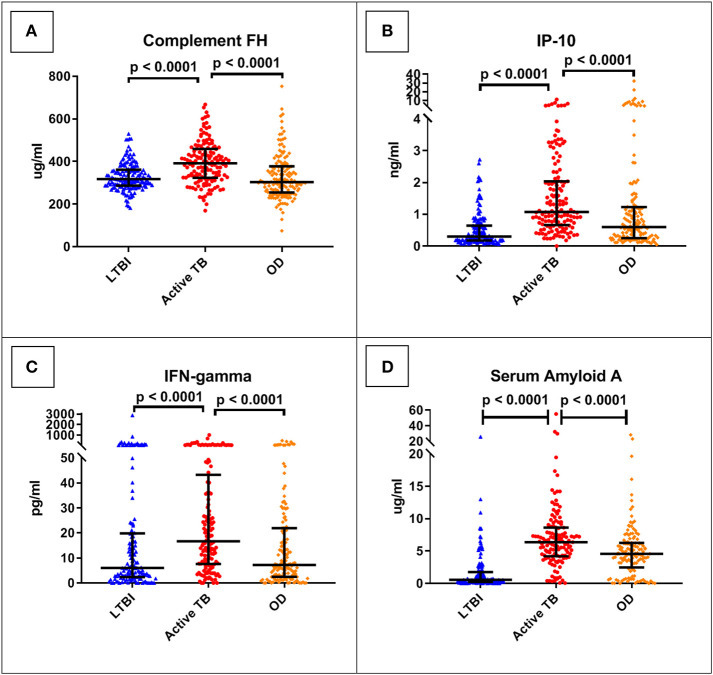
Figure 2.
Serum concentrations of the top four protein biomarkers (panels A–D) by clinical group. Scatter-dot plots show results for each patient in the ILULU-TB cohort, regardless of HIV status or site. P-values are 1-sided and derived from Mann-Whitney tests. Error bars represent medians and interquartile ranges. IP-10, IFN-gamma-inducible protein 10; IFN-gamma, interferon-gamma.

