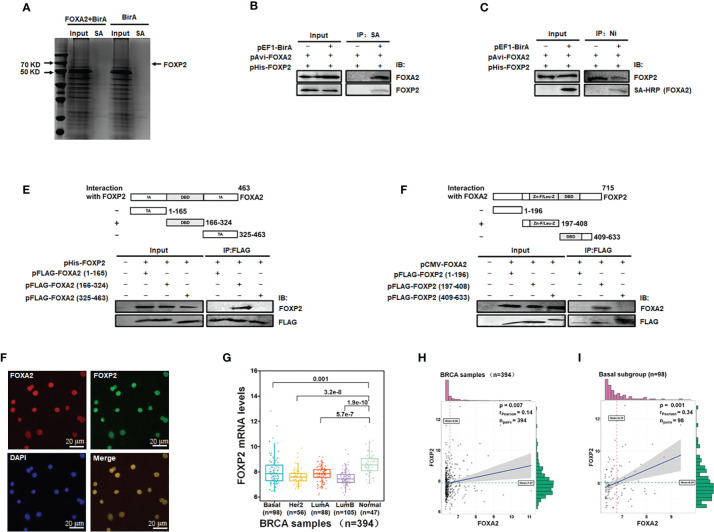
Figure 1.
Identification of FOXA2-interacting transcription factor FOXP2 in breast cancer cells. (A) The lysates of MCF-7 cells transfected with pAvi-FOXA2, pEF1-BirA, or both, were incubated with streptavidin resin. The pull-down proteins were separated by PAGE and visualized with coomassie brilliant blue staining. The position of FOXP2 was pointed out in the lane of the FOXA2+BirA sample on the gel. (B, C) The interaction between FOXA2 and FOXP2 in cells. The lysates of cells transfected with pAvi-FOXA2 and pHis-FOXP2 or pEF1-BirA, were pulled down with streptavidin resin (B) or Ni beads (C). Western blotting was performed with anti-FOXA2 antibody, anti-FOXP2 antibody, or streptavidin-conjugated HRP (SA-HRP) respectively. (D, E) Mapping the regions mediating FOXA2-FOXP2 interaction in the proteins. The lysates of cells transfected with pHis-FOXP2 plus one of expressing plasmid vectors containing Flag-tagged FOXA2 1-165aa, 166-324aa, and 409-633aa (D), or the lysates of cells transfected with pCMV-FOXA2 plus one of expressing plasmid vectors containing Flag-tagged FOXP2 1-196aa, 197-408aa, 325-463aa (E), were immunoprecipitated with anti-Flag antibody. Western blotting was performed with anti-FOXP2 antibody, anti-FOXA2 antibody, or anti-Flag antibody respectively. The top panel showed a schematic representation of the regions in FOXA2 protein (D) and FOXP2 protein (E). (F) The interaction of endogenous FOXA2 and FOXP2 was detected by the immunofluorescent microscopy in MCF-7 cells. The staining for FOXA2 (red), for FOXP2 (green), for DAPI (blue), and the merge of the FOXA2 and FOXP2 staining were shown. The cells were pictured by TE2000S (Nikon, 200×). (G) The levels of FOXP2 in the four subgroups (Basal, Her2, LumA, and LumB) of breast cancer and normal breast tissue in the clinical breast cancer samples (the BRCA data set, n=394). (H, I) The gene expression correlation analysis of FOXA2 and FOXP2 in the BRCA data set (n=394) (H) and in the Basal subgroup (n=98) (I) were executed by using ggstatsplot package through R project. The pink and green histograms represented the distribution of BRCA samples based on the levels of FOXA2 and FOXP2 expression respectively.

