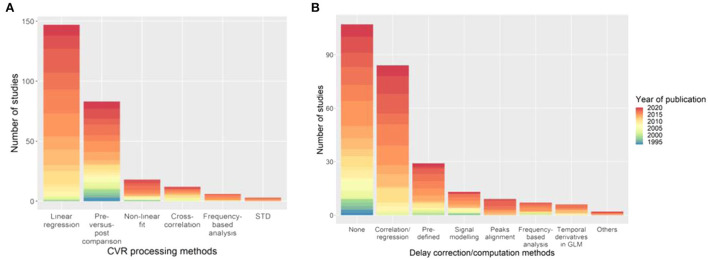
Figure 5.
Distribution of the (A) CVR processing and (B) delay computation methods with the associated year of publication of the paper. The category “Others” in (B) includes deconvolution to find the HRF between the EtCO2 and the MRI signal, and GLM with two (“fast” and “slow”) regressors. STD, standard deviation of MRI signal; HRF, haemodynamic response function; GLM, general linear model.

