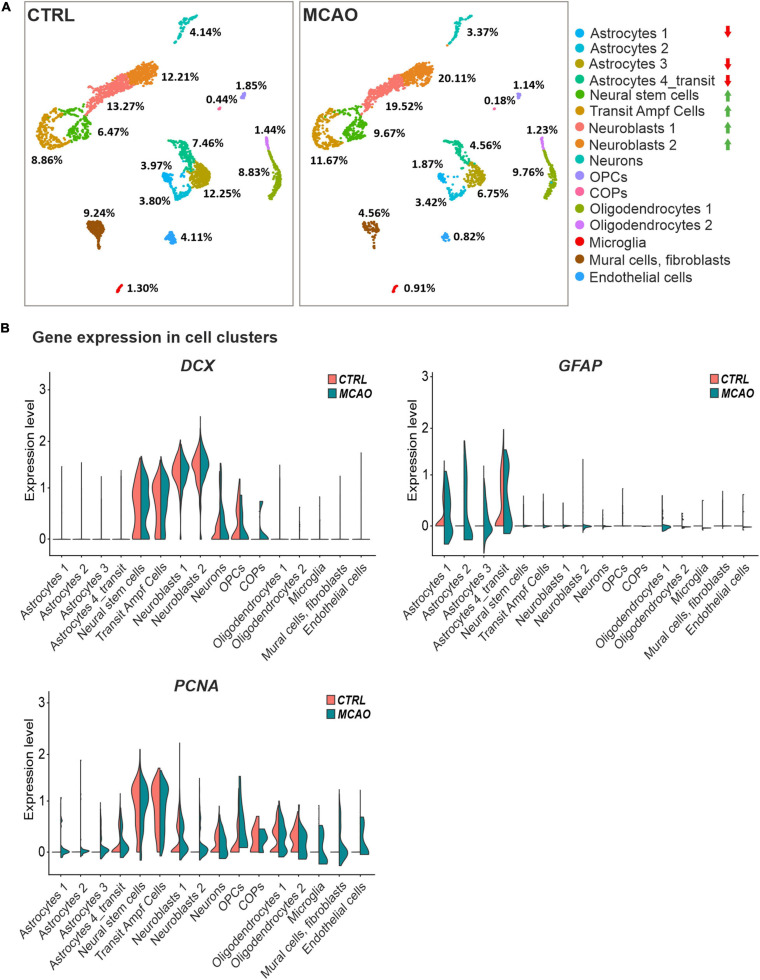
FIGURE 6.
Single-cell RNA sequencing analysis of cells obtained from the SVZ and striatum of the healthy (CTRL) and ischemic brain (MCAO). (A) Cell distribution in individual clusters (subpopulations); clusters with the most significant decrease or increase in cell counts after focal cerebral ischemia (FCI) are indicated by red or green arrows, respectively. The percentage of cells present in different cell clusters is indicated; RNA sequencing was performed on 3,694 and 2,728 cells obtained from the control or ischemic brain, respectively. After removing apoptotic cells, the remaining 2,923 (CTRL) and 2,193 (MCAO) cells were analyzed. More than 124,206 reads were obtained from one cell on average, representing 2,420 genes in the CTRL sample. In the brain after MCAO, the numbers were 175,361 reads per cell, representing 2,646 genes. (B) “Violin” plots showing the expression of DCX, GFAP, and PCNA in the indicated cell clusters. COPs, committed oligodendrocyte precursors; CTRL, control; DCX, doublecortin; GFAP, glial fibrillary acidic protein; MCAO, middle cerebral artery occlusion; OPCs, oligodendrocyte precursor cells; PCNA, proliferating cell nuclear antigen.

