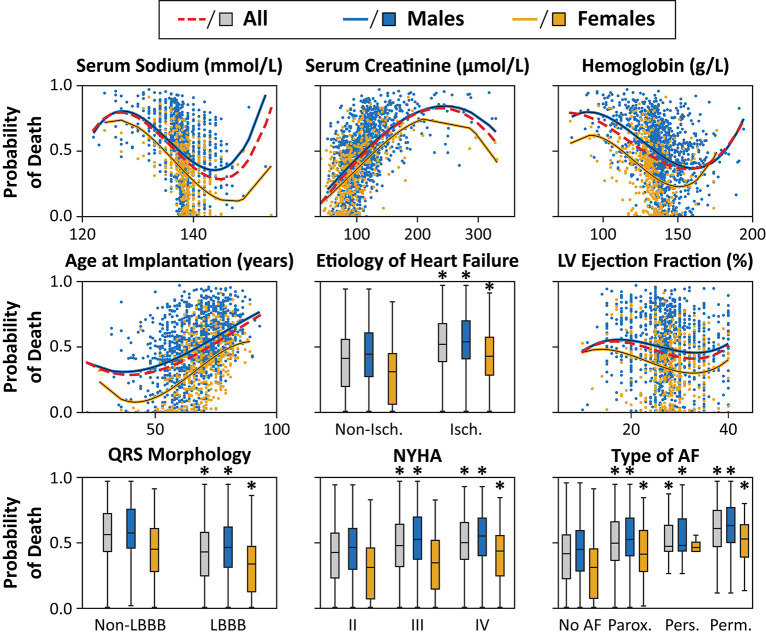
Figure 6.
Effect of the most important features on the predicted probability of 3-year all-cause mortality in the training cohorts. The probability of death was calculated for each patient in the training cohort with 10-fold cross-validation. The predicted probabilities are plotted for each patient, and second-order polynomial trendlines are fitted to their values. *p < 0.05 vs. non-ischemic/non-LBBB morphology/ NYHA class II/no AF, unpaired Student's t-test or Mann-Whitney U test. Abbreviations as in Figure 4.

