
Figure 5.
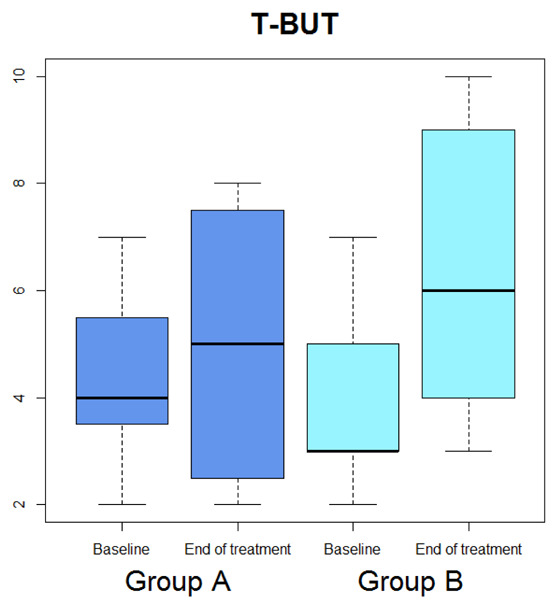
Box-plot concerning medians and interquartile ranges of T-BUT values at baseline and after the treatment in Group A and B
Official websites use .gov
A
.gov website belongs to an official
government organization in the United States.
Secure .gov websites use HTTPS
A lock (
) or https:// means you've safely
connected to the .gov website. Share sensitive
information only on official, secure websites.
Box-plot concerning medians and interquartile ranges of T-BUT values at baseline and after the treatment in Group A and B