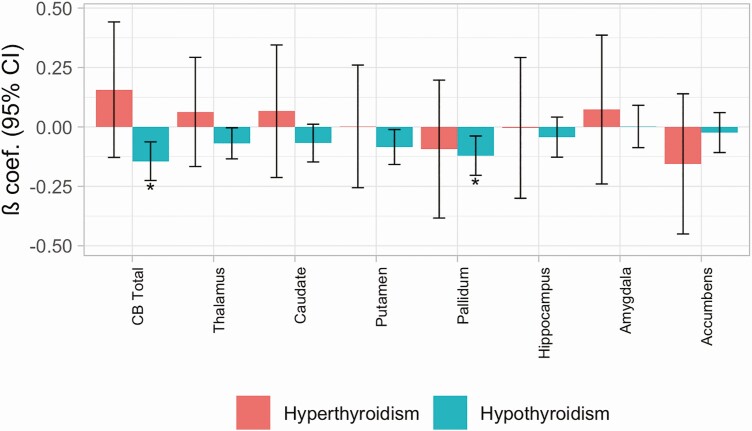
Figure 1.
Effect on total cerebellar (CB) and subcortical volumes of a diagnosis of hypothyroidism and hyperthyroidism compared to normative controls. All values are following correction for demographic and imaging covariates. Standardized beta coefficients (β) and 95% CI are provided. *signifies results with FDR < 0.05.

