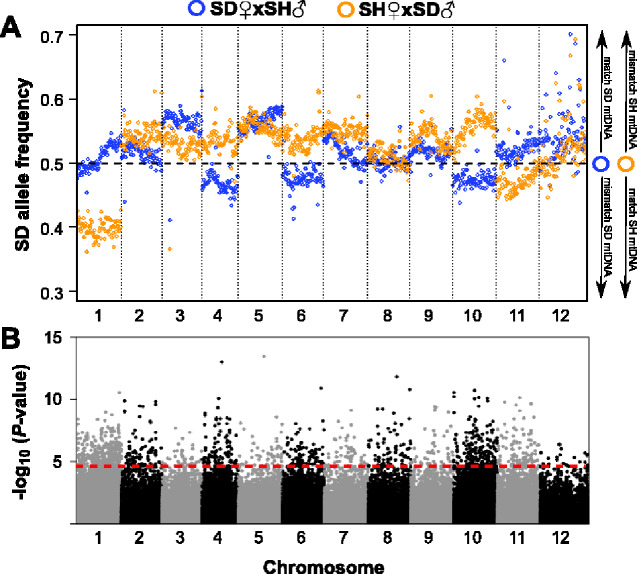
Fig. 4.
Pool-seq analysis of allele frequencies in slow-developing F2 hybrid copepods. (A) Allele frequencies for each reciprocal cross along the 12 autosomes. Each point represents a mean of frequencies across SNPs in 200-kb windows. Legend on right side of panel aids in interpretation of mitonuclear matching/mismatching; (B) Results of Z-statistics (Huang et al. 2012) comparing allele frequencies between crosses at individual SNP loci (n = 106,929). Red dashed line marks the false-discovery rate (FDR) threshold of 0.01.

