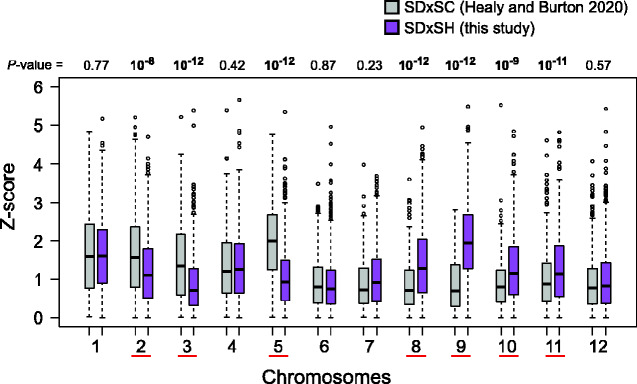
Fig. 5.
Comparison of allele frequencies deviations between crosses across chromosomes. Plotted are boxplot distributions of Z-statistics quantifying the difference in frequencies between fast-developers from reciprocal crosses in SD×SH (this study), and in SD×SC (SC = Santa Cruz, Healy and Burton 2020). Each boxplot comprises Z-statistics of 1,000 randomly sampled SNP loci. P-values are from Wilcoxon tests comparing Z-statistics between crosses, and underlined chromosomes are those showing significant differences.

