Fig. 1.
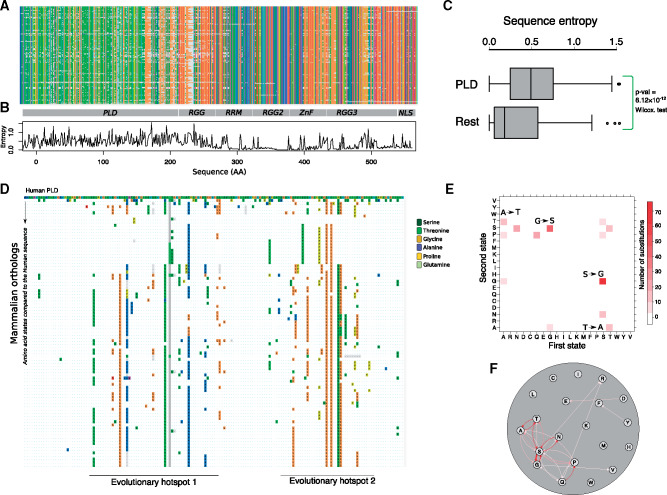
The PLD is the most variable domain of FUS in mammals. (A) Multiple sequence alignments of 105 mammalian FUS orthologs colored according to the CLUSTAL color scheme (Larsson 2014). (B) Shannon entropy of each amino acid site in the alignment. (C) Box plots comparing the sequence entropy of the amino acid sites in the PLD with the rest of the residues in FUS. (D) Substitution map of the PLD in mammals. The first row corresponds to the PLD sequence of human FUS color-coded in the CLUSTAL format. The following rows show the sequences of mammalian PLDs compared with the sequence of the human PLD in the first row. If, at any position, the amino acid is different from that of the human PLD, the new amino acid is shown by colored boxes. Identical amino acids are shown as blue dots. Amino acid substitutions involve changes to serine (forest green), threonine (green), glycine (orange), alanine (blue), proline (yellow), and glutamine (Emerald green). (E) Ancestral state mapping of substitutions in the evolution of PLD. Each box represents a substitution with its color saturation proportional to the number of such replacements. The first and second amino acids in a substitution are shown on the X and Y axes, respectively. Arrows highlight the especially frequent A to T, G to S, S to G, and T to A substitutions. (F) Ancestral state mapping from € represented as a directed graph. Each circle or node represents one amino acid, and substitutions are shown as edges that connect these nodes. The thickness of each edge corresponds to the number of substitutions between the two incident nodes. Substitutions with more than Ancestral state mapping ten occurrences are shown in red.

