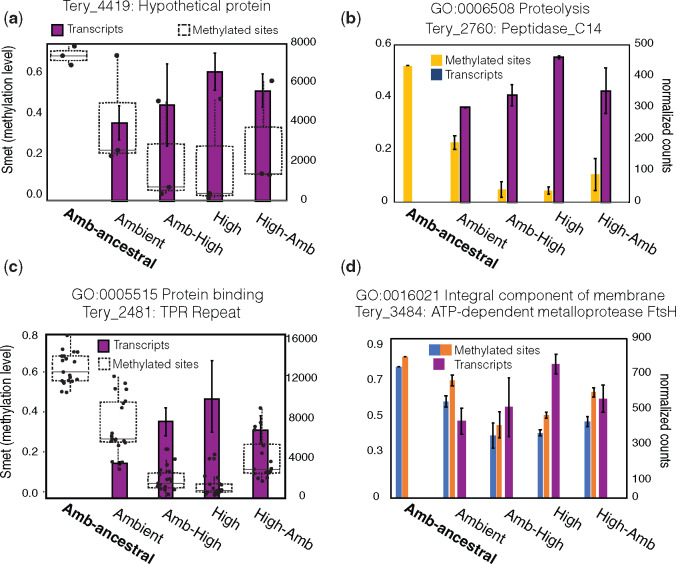
Fig. 4.
Gene-specific transcript profiles containing DM sites in high-CO2. Methylation levels (Smet; no. of reads with a methylated cytosine/total no. of reads mapping to that cytosine) of intragenic/promoter DM sites (left axis) and expression level of the corresponding gene (right axis). (a) Methylation (boxplot) and transcriptional (bar plot) profiles of a gene (Tery_4419) containing 2 DM sites in its promoter and 1DM site in the gene body while also exhibiting differential expression across the high-CO2 conditions. (b) An intragenic DM site exhibiting significantly reduced methylation levels (Smet) across high-CO2 phenotypes (yellow bar; left y-axis) in concert with significantly increased transcript levels of the gene Tery_2760 (blue bars, right y-axis). (c) Methylation (boxplot) and transcriptional profiles (bar plot) of a gene (Tery_2481) containing DM sites and upregulated expression. This gene contains 19 intragenic DM sites and the clear boxplots show the distribution of Smet methylation levels of all sites across experimental conditions demonstrating reduced methylation in high-CO2 phenotypes (left y-axis). The bar plots show the corresponding gene expression level (right y-axis) exhibiting highest expression in high-CO2 phenotypes. (d) This plot is the same as in (b) except now there are two intragenic DM sites (light blue and orange bars) plotted adjacent to the corresponding transcript levels of that gene (dark blue bars) *In transcript plots (a−d), no transcript data are available for the 380-ancestral. Bars and error bars in bar plots are means and standard deviations of three biological replicates for methylation levels and two biological replicates for RNA-Seq. Genes inside of overrepresented GO pathways are denoted above the plots.

