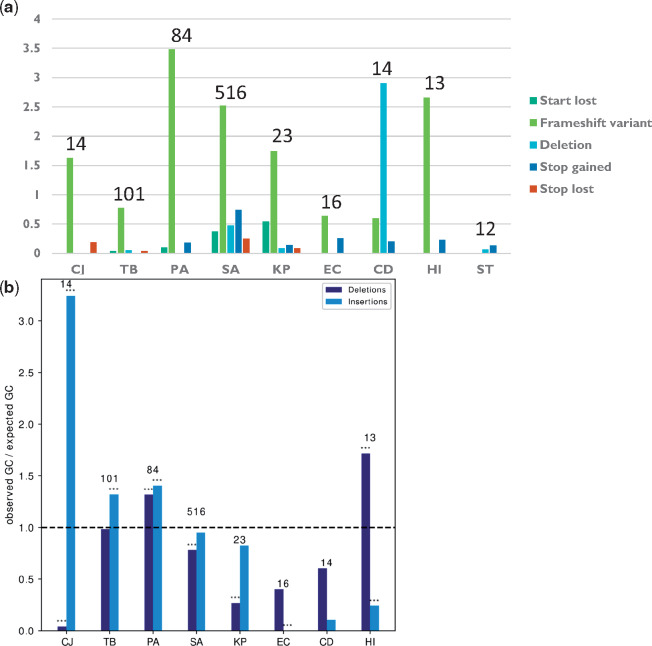
Fig. 4.
Adaptive loss of function is mostly mediated by frameshift mutations. (a) The number of adaptive loss of function events due to different loss of function mechanisms, normalized by the number of progenitor–progeny pairs in each species. (b) %GC in insertions or deletions leading to frameshift events underlying adaptive loss of function, normalized by the %GC of the entire genome of each species. Asterisks denote %GC that statistically significantly differs from the %GC of the entire genome by binomial test. *P ≤ 0.05, **P ≤ 0.01, and ***P ≤ 0.001. Names of bacterial species are as in figure 1b. The numbers above the bars represent the number of strains included for that bacterial species.

