Fig. 1.
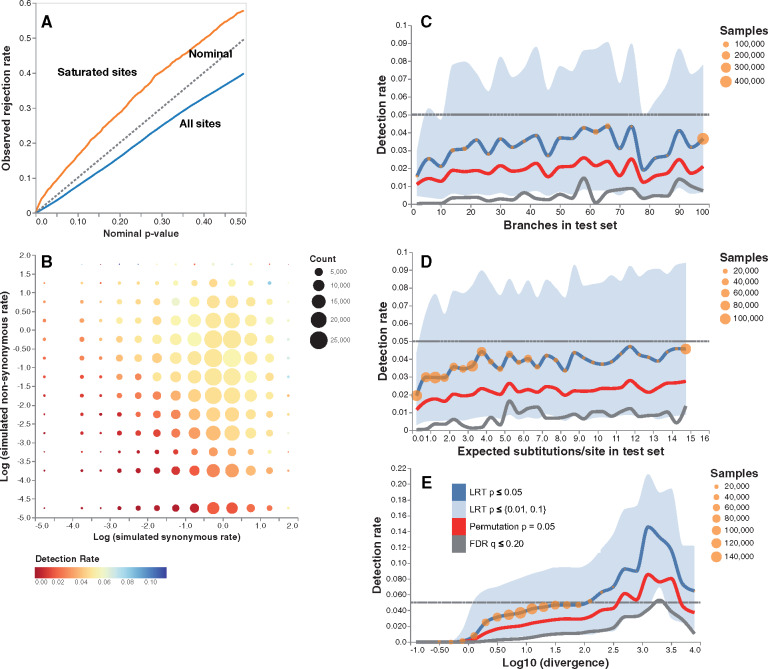
Contrast-FEL performance on null data (error control). The plots are based on 1,090,929 variable sites simulated with equal nonsynonymous rates on two branch sets (see text for simulation details). (A) Q–Q plots of LRT P-values for all sites (blue line) and for 3,684 saturated sites ( of the divergence level between 2.5 and 3.5, orange line). (B) Detection rate as a function simulated synonymous and nonsynonymous substitution rates ( scale). (C) Detection rate as a function of the number of branches in the test set (binned in increments of 5). Blue line: proportion of sites with LRT P < 0.05, red line: proportion of sites with permutation P < 0.05, gray line: proportion of sites with q < 0.20. Blue area plot shows for the proportion of sites with LRT P < 0.01 (lower) and LRT P < 0.1 (upper). Orange circles reflect the number of sites contributing to each bin. (D) Detection rate as a function of the total branch length of the test set of branches (binned in increments of 0.5); same notation as in (C) otherwise. (E) Detection rate as a function of the of the divergence level at the site (binned in increments of 0.25); same notation as in (C) otherwise.

