FIGURE 1.
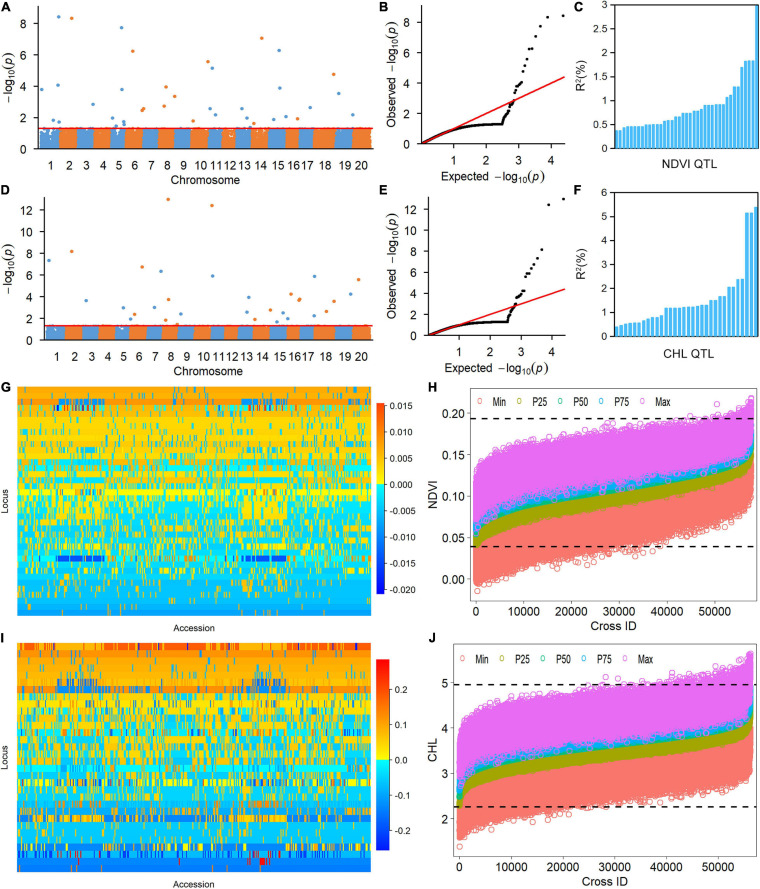
Genetic analysis of NDVI and CHL phenotypic variation in the soybean population using the restricted two-stage multi-locus genome-wide association study (RTM-GWAS) method. (A) Manhattan plot of the RTM-GWAS results for NDVI. (B) QQ plot of the RTM-GWAS results for NDVI. (C) The phenotypic contribution of the detected 38 NDVI QTLs. The vertical and horizontal axes indicate the genetic contribution R2 (%) and the order of QTLs according to their genetic contribution. (D) Manhattan plot of RTM-GWAS results for CHL. (E) QQ plot of the RTM-GWAS results for CHL. (F) The phenotypic contribution of the detected 32 CHL SNPLDBs. The vertical and horizontal axes indicate the genetic contribution R2 (%) and the order of QTLs according to their genetic contribution. (G) The NDVI QTL–allele matrix. (H) The predicted NDVI of progenies in the optimal crosses among the 341 lines based on the linkage model. On the horizontal axis, the crosses are arranged in increasing order of the predicted 50th percentile (P50) NDVI from left to right. The black dotted horizontal lines are the minimum and maximum values in the entire population, which were 0.039 and 0.193, respectively. The vertical axis is the predicted NDVI value of the crosses. (I) The CHL QTL–allele matrix. (J) The predicted CHL of the progenies in the optimal crosses among the 341 lines based on the linkage model. On the horizontal axis, the crosses are arranged in increasing order of the predicted 50th percentile (P50) NDVI from the left to right. The black dotted horizontal lines are the minimum and maximum values in the entire population, which were 2.26 and 4.95, respectively. The vertical axis is the predicted CHL value of the crosses.

