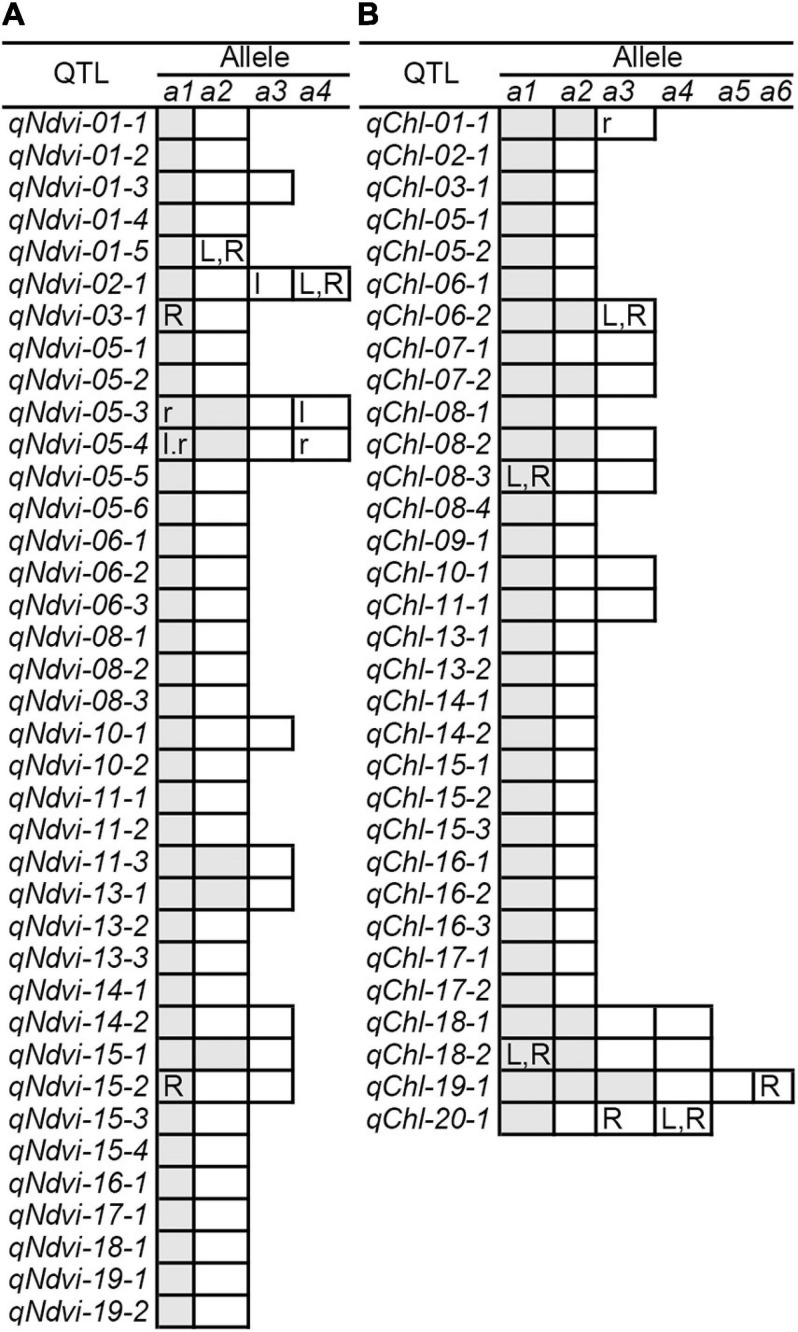
FIGURE 3.
QTL-allele changes among populations. (A) NDVI QTL-allele changes among populations. (B) CHL QTL-allele changes among populations. a1 –a6 are the alleles of each QTL, arranged in descending order according to their allele effect values. The cells marked with white (positive effect) and gray (negative effect) are all alleles in WA. The cells with lowercase letters l and r are alleles excluded in LR and RC (vs. WA), respectively. The uppercase letters L and R in cells are alleles that emerged in LR and RC (vs. WA), respectively. In addition, the QTL qNdvi-01-5 emerged in LR and was not polymorphic in WA. The QTL qNdvi-03-1 emerged in RC and was not polymorphic in WA and LR.

