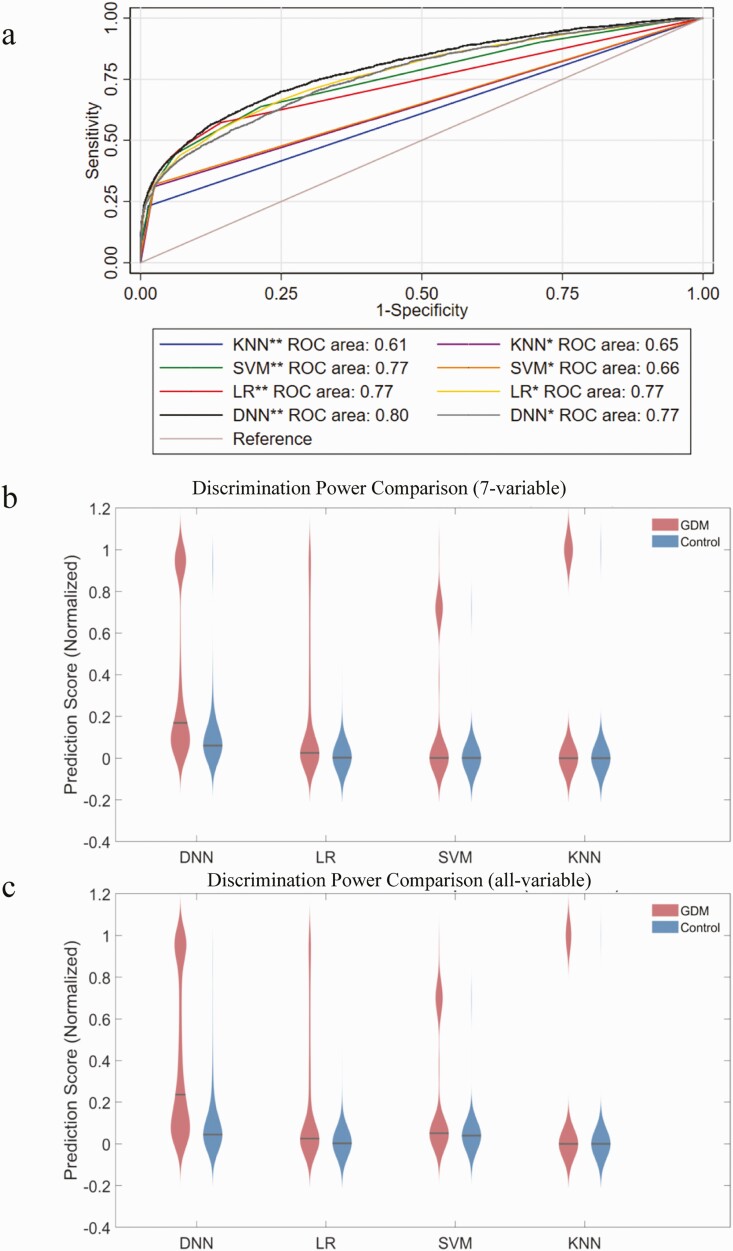
Figure 3.
Discriminative power comparison between different prediction models. A, Receiver operating characteristic (ROC) curves of different prediction models based on the 7-variable panel (*) and all-variable panel (**). B and C, Violin plot comparisons of predicted score distribution using different prediction models with the 7-variable panel and the all-variable panel.

