
Figure 4.
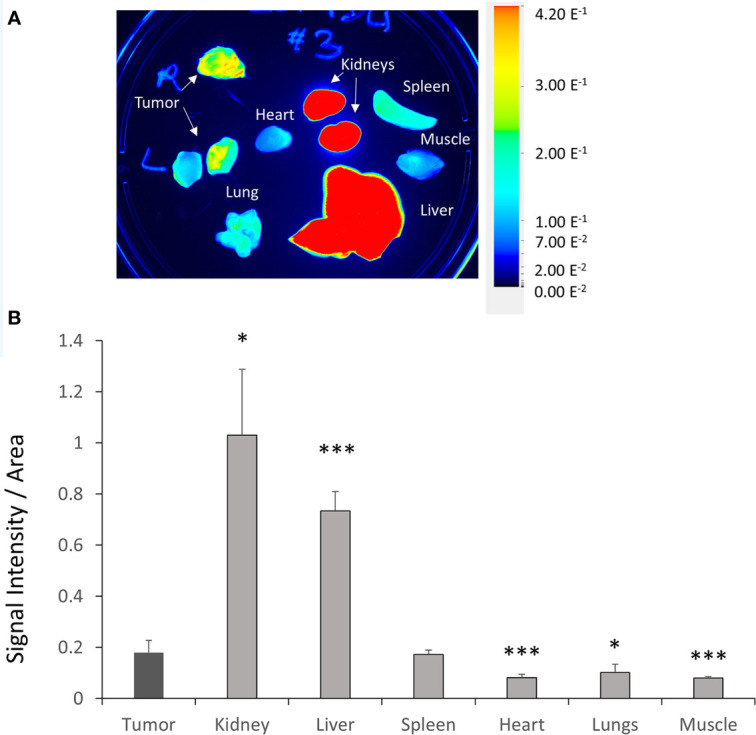
Ex vivo PD-L1 siRNA dextran NP biodistribution in subcutaneous tumors. (A) Representative ex vivo images acquired from subcutaneous MDA-MB-231 tumors, kidneys, liver, spleen, lungs, heart, intestine, and muscle 24 h after the second injection of PD-L1-siRNA-dextran NPs. (B) Quantification of fluorescent signal in subcutaneous MDA-MB-231 tumors, kidneys, liver, spleen, lungs, heart, intestine, and muscle measured ex vivo 24 h after the second PD-L1-siRNA dextran NP injection (group 1, n = 6). *p < 0.05, ***p < 0.005 compared to the fluorescent signal measured in the tumor.