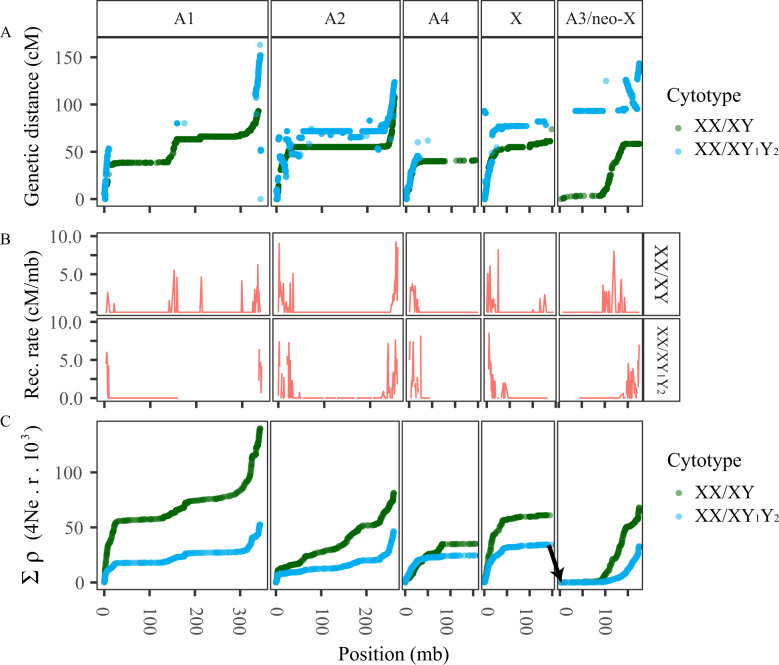
Fig. 1.
The recombination landscape across the chromosomes of Rumex hastatulus. (A) Marey map relating linkage map sex-averaged recombination position (cM) to physical genetic position in the XX/XY-cytotype genome assembly (Mb; panels are XX/XY-cytotype chromosomes) for the XX/XY cytotype (green) and XX/XY1Y2 cytotype (blue). (B) Sex-averaged recombination rate (cM/bp), estimated as coefficients of linear models for 1Mb windows. (C) Cumulative sex-averaged recombination rate (ρ) estimated from population-level genetic sequencing for the XX/XY cytotype (green) and XX/XY1Y2 cytotype (blue). Cumulative recombination estimates have been reset to start at zero at the border of the XX/XY1Y2-cytotype neo-sex chromosome to facilitate direct comparison with the XX/XY-cytotype A3. Black arrow shows linkage between X and A3 (the XX/XY1Y2-cytotype neo-sex chromosome) in the XX/XY1Y2-cytotype, which has been repositioned on A3 for more direct comparison between the cytotypes.

