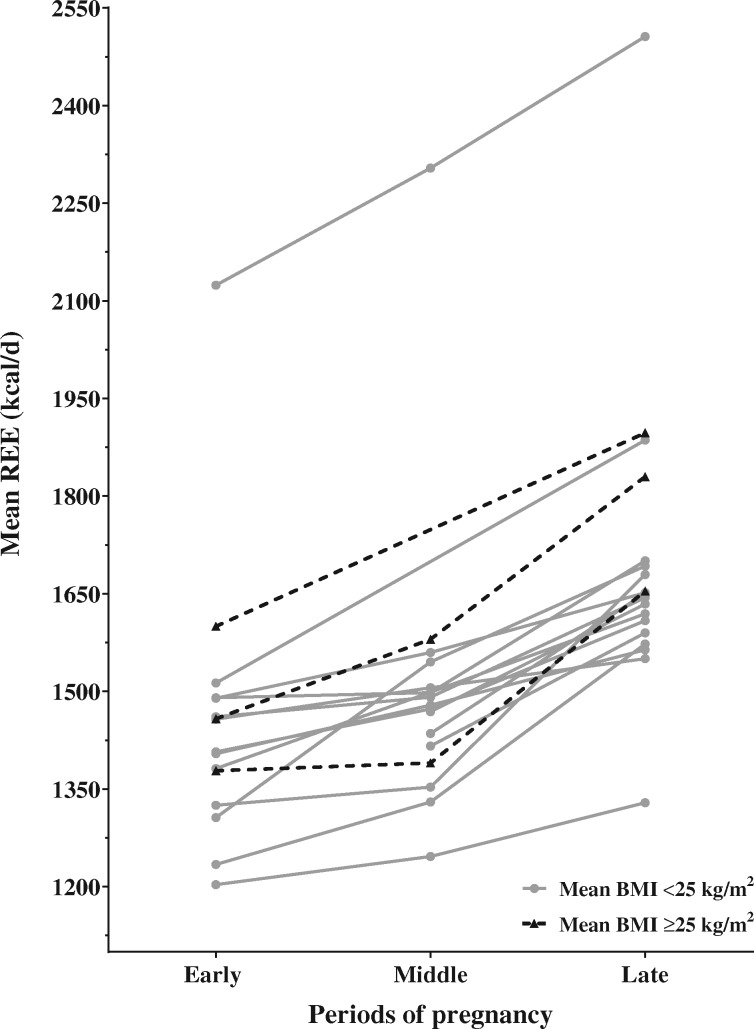
Figure 2.
Change in resting energy expenditure throughout pregnancy for the included studies. Each data point represents the mean value of energy expenditure reported by studies that measured resting energy expenditure. Means from the same study are linked by the same line. Solid gray lines and dotted black lines represent the studies for which the participants’ mean prepregnancy BMI was <25 kg/m2 and ≥25 kg/m2, respectively. Abbreviation: REE, resting energy expenditure

