Figure 2.
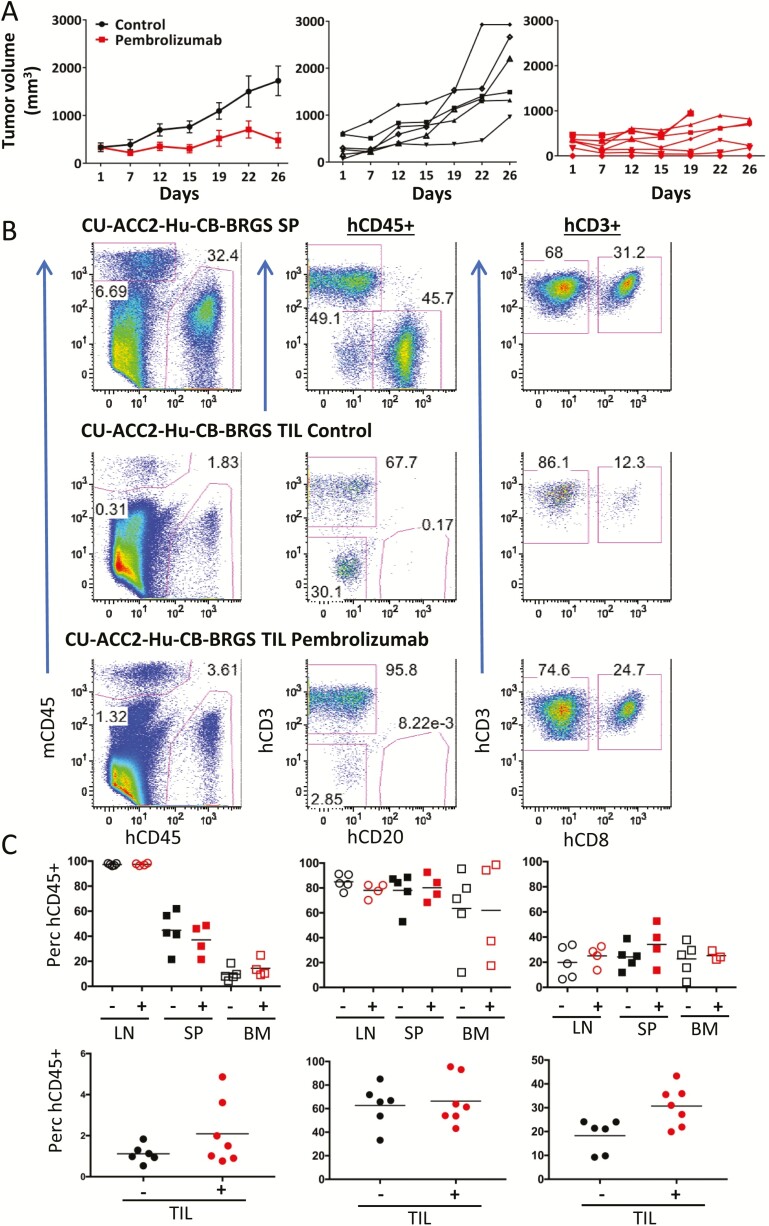
Reduced tumor growth correlates with increased CD8+ T-cell infiltration into tumor of CU-ACC2-hu-CB-BRGS mice treated with pembrolizumab. A, Tumor growth curves of untreated (black) or pembrolizumab-treated (red) CU-ACC2-hu-CB-BRGS mice. Top graph shows mean ± standard error of the mean and individual data points are shown in middle (control) and bottom (pembrolizumab) graphs. B, Human hematopoietic and T-cell chimerism of peripheral lymph organs and TILs of CU-ACC2-hu-CB-BRGS mice. Representative flow cytometry plots distinguishing mouse (mCD45, myeloid lineage) and human (hCD45) hematopoietic cells (left), human T (CD3) and B (CD20) lymphocytes among the hCD45+ cells (middle), and CD8 T cells (right) in indicated tissues (SP or TIL) of ACC2-hu-CB-BRGS mice, either untreated (SP, TIL; top) or treated with pembrolizumab (TIL; bottom). C, The graphs show percentages of human hematopoietic cells (top), human T cells (middle) within the hCD45+ gate, and CD8+ cells of the T cells (bottom) from all mice in the indicated tissues with (+) or without (-) anti-PD-1 treatments. Lines are arithmetic means. P values: *< 0.05, **< 0.01.

