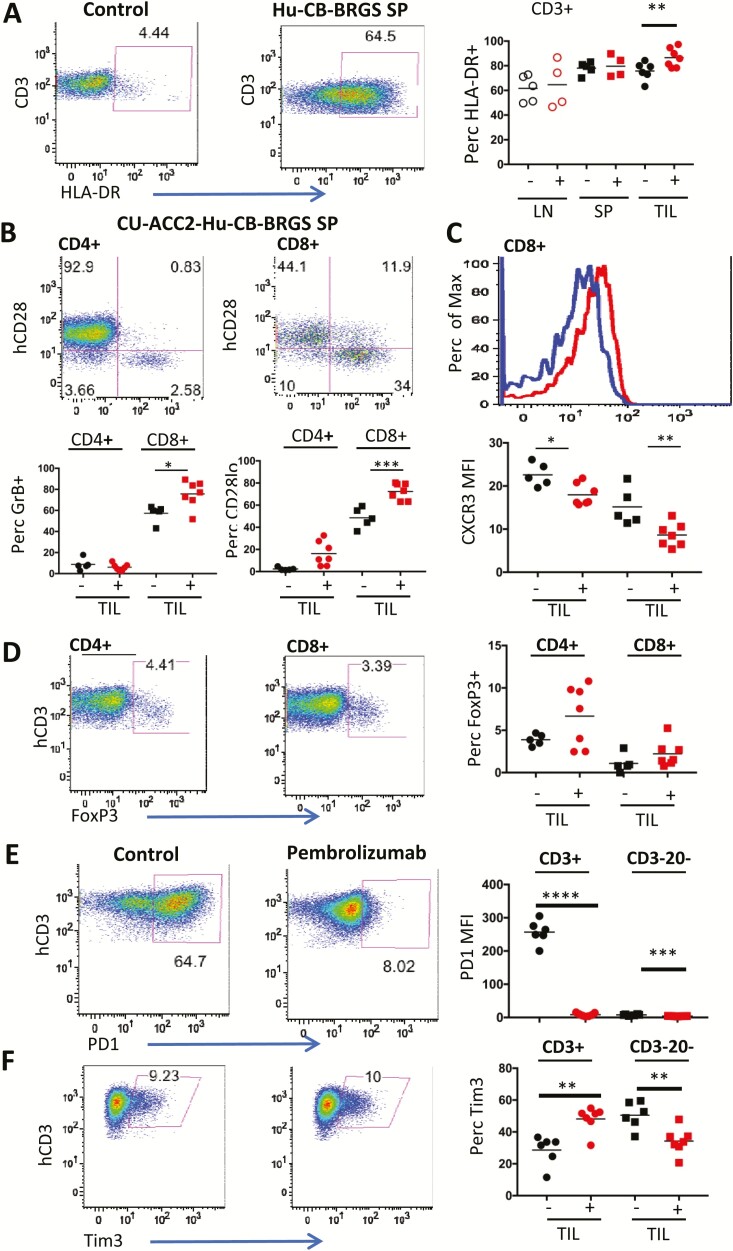
Figure 3.
Functional analysis of T cells in untreated or pembrolizumab-treated CU-ACC2-hu-CB-BRGS mice. A, Representative flow plot illustrating expression and gating of HLA-DR on human T (hCD45+CD3+) cells in control (top, CB T cells) or spleen from untreated humanized mouse (bottom) and graph on bottom displays the percentage of HLA-DR+ for each mouse in indicated tissue. B, Representative flow plots illustrating gating strategy for expression of CD28 and GrB among CD4 (top) or CD8 (bottom) T cells (hCD45+CD3+) in the spleen of an untreated CU-ACC2-hu-CB-BRGS mouse. The graphs on the right show the percentages of GrB+ (top) or CD28lo (bottom) for CD4+ (left) or CD8+ (middle) T cells in the TILs. C, Histogram illustrating the expression of chemokine receptor CXCR3 on CD8+ T cells from the spleen in panel B that were either secreting GrB or not. The graph on the right shows the MFI of CXCR3 for CD4+ (left) or CD8+ (right) T cells in TILs. D, T regulatory cells in CU-ACC2-hu-CB-BRGS mice. Flow plots show the gating strategy for expression of FoxP3 among CD4+ and CD8+ human T cells (hCD45+, hCD3+) in a spleen from a CU-ACC2-hu-CB-BRGS mouse and data from each tumor from untreated (-) or pembrolizumab-treated (+) are shown in the graph on the right. Expression of inhibitory receptors (E) PD-1 and (F) Tim3. Flow cytometry panels (left) from a spleen of a humanized mouse depicting the expression of (E) PD-1 and (F) Tim3 and data for expression in T cells (hCD45+,CD3+, left) and myeloid cells (hCD45+,CD3–,CD20–, right) for each tumor is shown. For all graphs, each dot represents data from the indicated organ from an individual humanized mouse that was either untreated (-) or treated with pembrolizumab (+). Lines are arithmetic means. P values: *< 0.05, **< 0.01, ***< 0.001, ****< 0.0001. MFI, mean fluorescence intensity.

