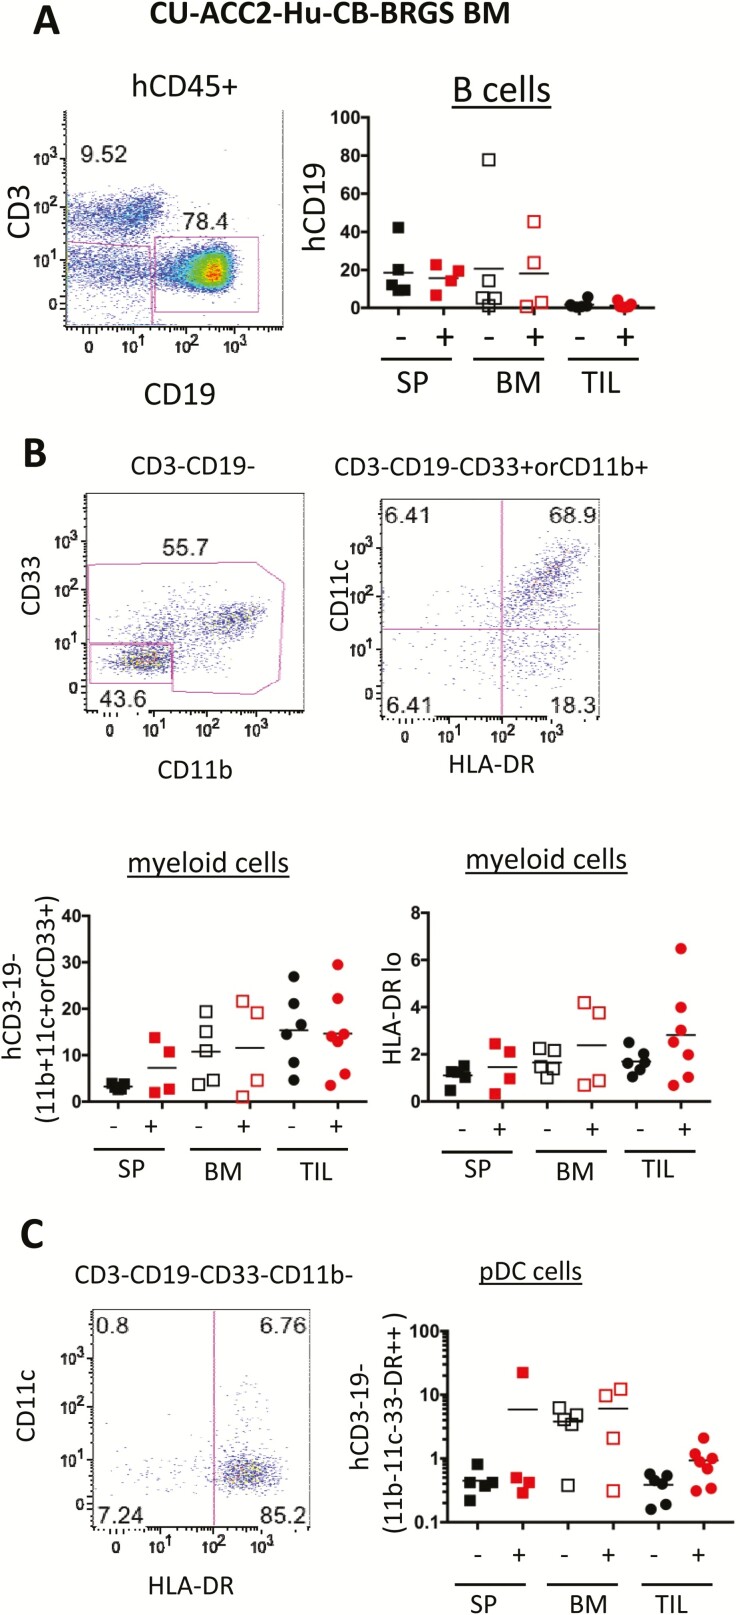
Figure 4.
Analysis of human B-cell and myeloid populations in the peripheral lymph organs and TILs of CU-ACC2-hu-CB-BRGS mice. A, Representative flow cytometry plot from the BM of a CU-ACC2-hu-CB-BRGS mouse indicating the gating strategy for quantification of B cells (hCD45+CD19+) with data from each mouse indicated in the lower graph. B, Representative flow cytometry plots (upper), and graphs below showing individual analysis for each CU-ACC2-hu-CB-BRGS mouse, from the bone marrow of the same CU-ACC2-hu-CB-BRGS mouse as in panel A indicating the gating strategy for myeloid cells (left, hCD45+, CD3–CD19–, CD33+, CD11b+, or CD11c+); or HLA-DRlo/– among these myeloid cells. C, Representative flow cytometry plot (upper), and graph below showing individual analysis for each CU-ACC2-hu-CB-BRGS mouse, from the BM of the same CU-ACC2-hu-CB-BRGS mouse as in panel A indicating further gating strategy for pDCs (hCD45+, CD3–, CD19–, CD33–, CD11b–, CD11c–, HLA-DRhi). For all graphs, each dot represents data from the indicated organ from an individual humanized mouse that was either untreated (-) or treated with pembrolizumab (+). Lines are arithmetic means. pDC, plasmacytoid dendritic cells.

