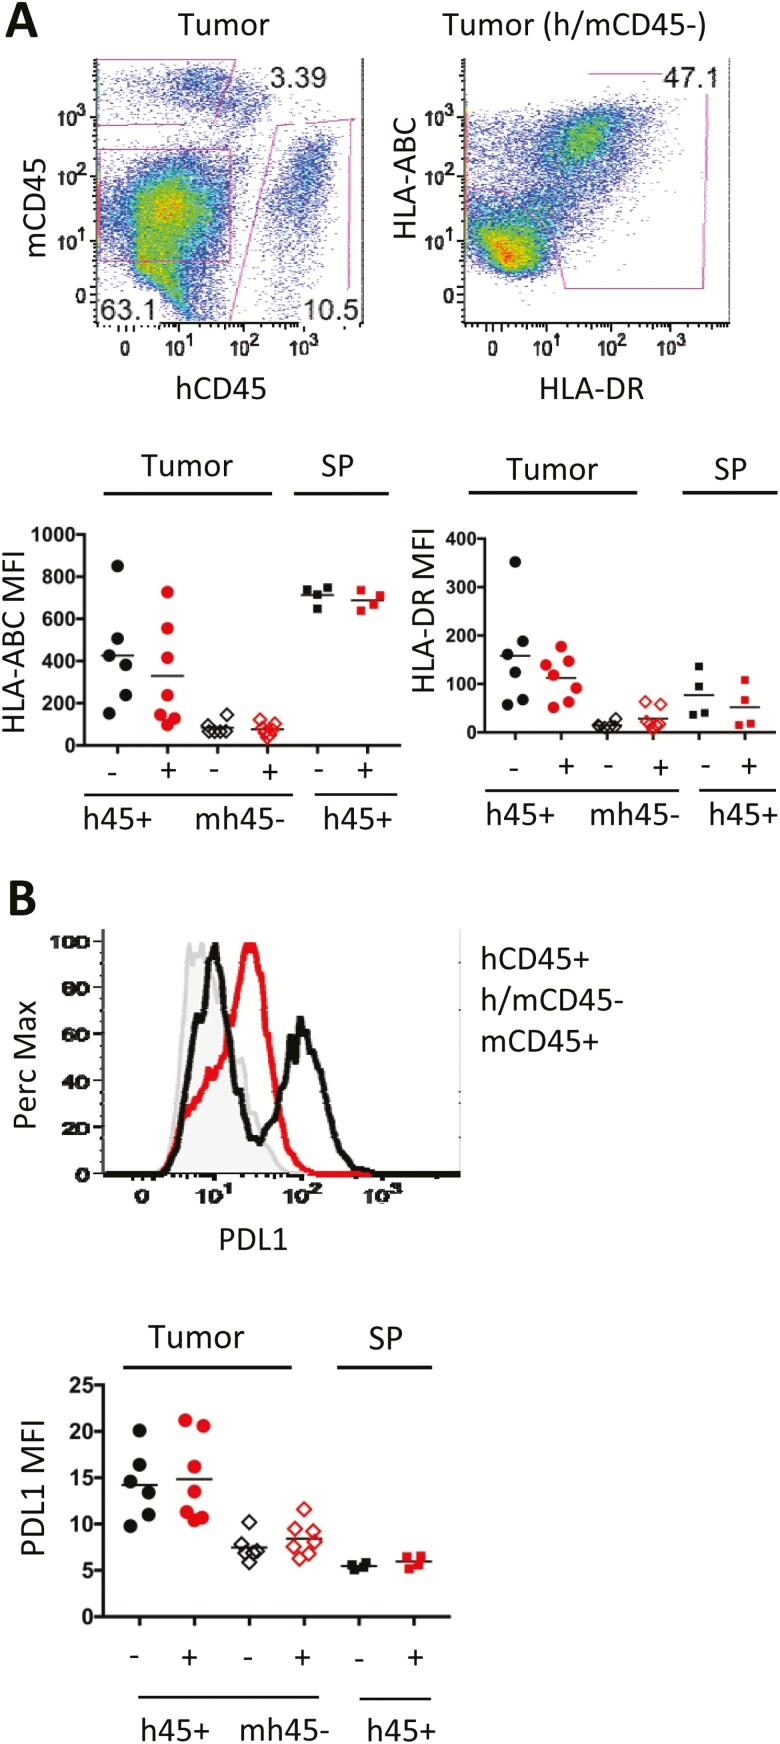
Figure 5.
Expression of human antigen-presentation molecules and PDL1 in the tumor in CU-ACC2-hu-CB-BRGS mice. A, Flow cytometry plots of a digested tumor showing gating strategy to identify the tumor cells (mCD45–, hCD45–, left plot and HLA-ABC+, HLA-DR+, right plot). B, Flow histogram from a digested tumor showing relative expression of PDL1 on tumor cells (red line) and compared with expression on human hematopoietic cells (black line) or negative control mouse hematopoietic (mCD45+) cells (gray). A-B, The graphs show the expression of HLA-ABC (A, left) or HLA-DR (A, right) and PDL1 (B) for each tumor for the indicated populations (human hematopoietic: h45+, tumor: mh45–). Human (h45+) hematopoietic cells from the spleen serve as positive controls for each stain. For all graphs, each dot represents data from the indicated organ from an individual humanized mouse that was either untreated (-) or treated with pembrolizumab (+). Lines are arithmetic means.

