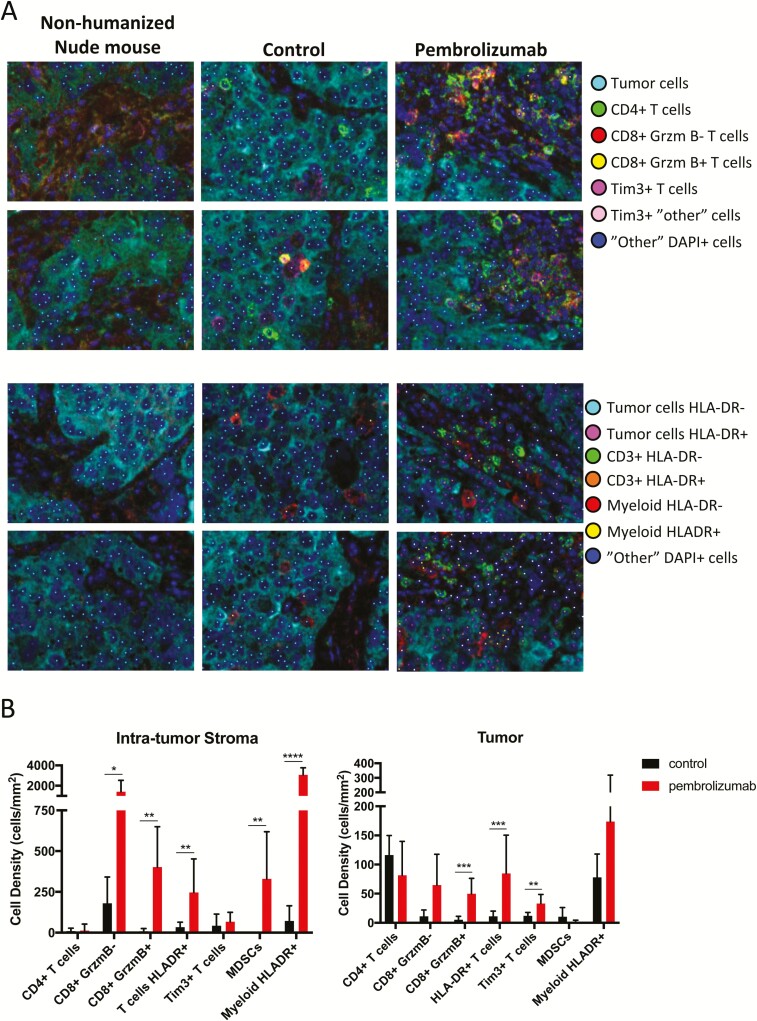
Figure 6.
Activated immune cells are increased in the tumor and the intra-tumor stroma following anti-PD-1 treatment. A, Tumors from CU-ACC2-hu-CB-BRGS mice stained with two seven-color IHC panels and analyzed by multispectral imaging. Cellular phenotypes were analyzed using inForm software and are indicated by the colored dots. B, The density of cells for each indicated cellular phenotype was determined for intratumor stroma regions (top) or tumor regions (bottom) in control tumors (black) or pembrolizumab treated tumors (red). Lines indicate standard deviations. *P < 0.05, **P < 0.01, ***P < 0.001, ****P < 0.0001.

