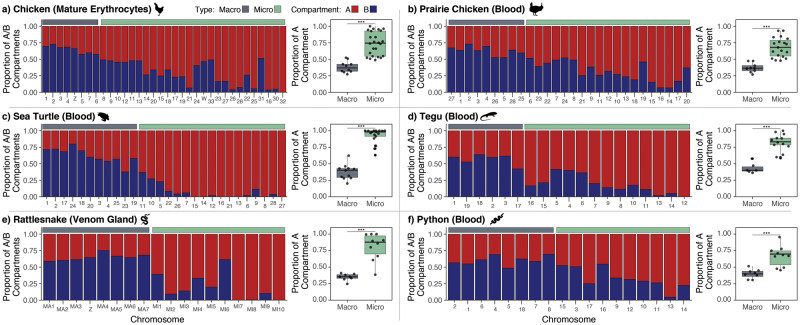
Fig. 2.
Microchromosomes are enriched for the A compartment. Bar plots indicate the proportion of 50-kb bins for each chromosome that were determined to be A (red) and B (blue) compartment. In all species, microchromosomes exhibit a higher proportion of A compartment bins than macrochromosomes (boxplots on right; *** denotes P < 0.001, Student’s t-test).

