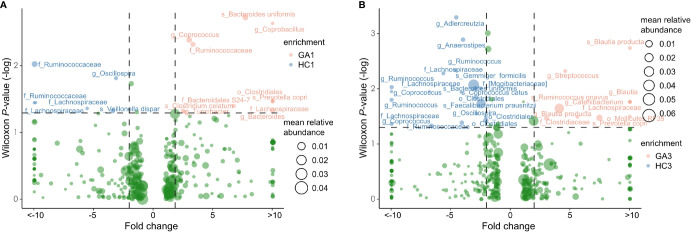
Figure 3.
Volcano plot showing significant variation in OTUs between patients and controls in the first (A) and third (B) trimesters. Only the OTUs with average relative abundances greater than 0.01% of total abundance in all samples are shown for clarity. Red and blue circles represent the GA- and control-enriched OTUs, respectively.

