FIGURE 3.
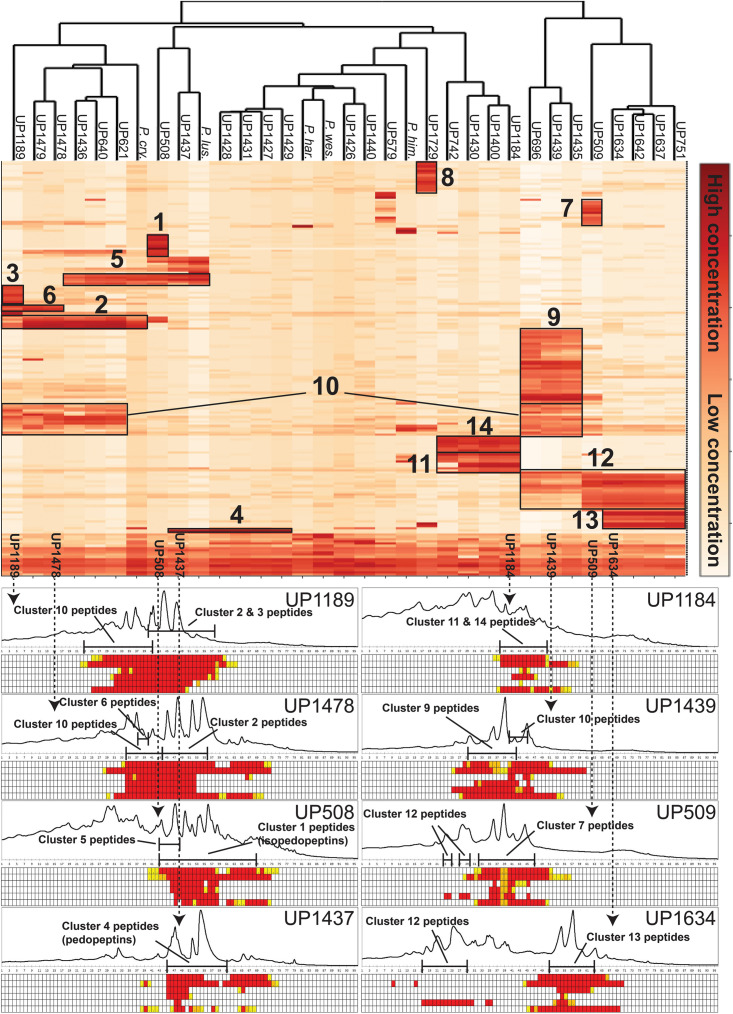
Top: Heat map generated by hierarchical clustering (Euclidean, complete) of major compounds (rows) produced by 33 strains of Pedobacter (columns) as analyzed by UHPLC-MS. Numbers indicate clustering of compounds discussed in the text. [UP-strains are from this work. P. cry., Pedobacter cryoconitis A37 (LMG 21415T); P. lus., P. lusitanus NL19 (LMG 29220T); P. har., P. hartonius WB 3.3-3 (DSM 19033T); P. wes., P. westerhofensis WB 3.3-22 (DSM 19036T); P. him., P. himalayensis HHS22 (JCM 12171T).] Bottom: Chromatograms (A210) from HPLC-fractionation of the indicated Pedobacter isolates, with data from bioassays against a panel of bacterial pathogens under each chromatogram. Bacteria are shown in rows (from top to bottom: E. coli, A. baumannii, E. cloacae, K. pneumoniae, P. aeruginosa, and S. aureus) and HPLC fractions in columns. Activity grading of fractions is ranging from red (full inhibition) to white (no visible inhibition). The presence of peptides from clusters 1–14 is indicated in each chromatogram.

