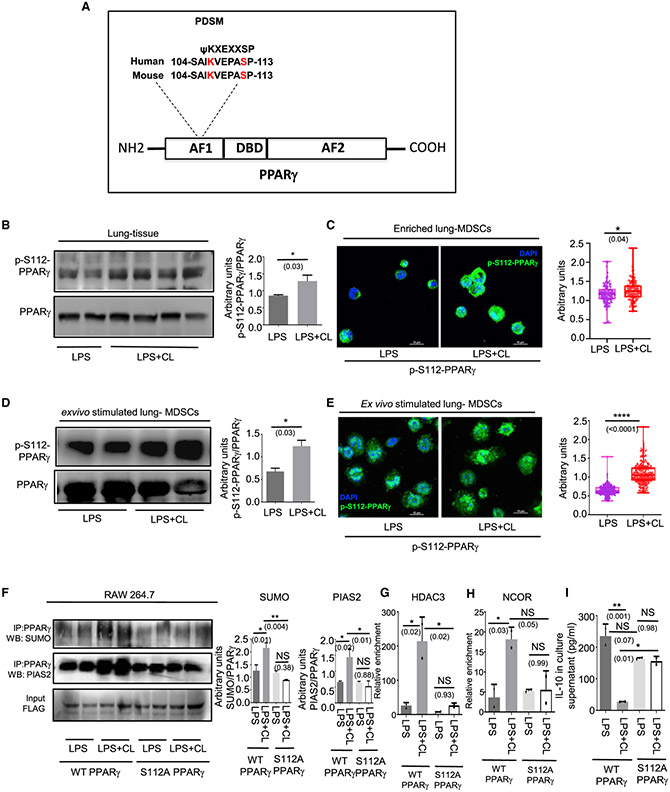
Figure 2. CL-mediated PPARγ K107 SUMOylation is controlled by a concomitant S112 phosphorylation.
(A) Amino acid sequence of PPARγ showing a phosphorylation-dependent SUMOylation motif at the 112 residue and sequence homology between Homo sapiens and Mus musculus.
(B and C) LPS ± CL was administered i.t. in 8- to 10-week-old C57BL/6 mice. On day 6, mice were sacrificed for outcome measures.
(B) PPARγ S112 phosphorylation was detected in whole lung tissue lysate by western blot (left panel) along with its quantitative densitometry analysis (right panel).
(C) Representative immunofluorescence images showing expression of S112 phosphorylated PPARγ in enriched lung MDSCs. The nuclear stain DAPI is represented by blue and phospho-S112 PPARγ is represented by green pseudo-colors. Quantification of the mean fluorescence normalized to total-PPARγ is shown alongside. A minimum of 100 cells from 3 mice in each group was considered for quantitation.
(D and E) Lung MDSCs were enriched from 8- to 10-week-old C57BL/6 mice and stimulated ex vivo with LPS ± CL for 3h.
(D) PPARγ S112 phosphorylation detected in these cells by western blot, represented alongside its quantitative densitometry analysis.
(E) S112 phosphorylation of PPARγ detected by immunofluorescence along with quantitation of its mean fluorescence normalized to total PPARγ. A minimum of 200 cells from 2 biological replicates in each group was analyzed for quantitation. DAPI is represented by blue and phospho-S112 PPARγ is represented by green pseudo-colors.
(F–I) 106 RAW 264.7 cells were transfected with either wild-type PPARγ (FLAG-tagged) overexpression construct or PPARγ S112A mutant as shown. Cells were stimulated with LPS (1 μg/mL) ± CL (10 μg/mL) for 3 h. (F) PPARγ was immunoprecipitated with anti-FLAG antibody followed by western blot analysis with SUMO1 antibody (top panel) as well as PIAS2 antibody (center panel). Densitometric analysis of each blot is represented alongside as indicated. ChIP analysis was performed to investigate the recruitment of (G) HDAC and (H) NCOR to the IL-10 promoter. (I) IL-10 in culture supernatant was measured by ELISA after 6 h of LPS ± CL treatment.
All ex vivo and in vitro experiments were conducted with 2 replicates in each group. The data shown are means ± SDs and representative of 2 independent experiments. The hinges in the box and whisker graphs represent the interquartile distance and the whiskers represent the range. Each dot on the plots represents a biological replicate. Statistical significance was calculated using unpaired t test for (B)–(E) and 1-way ANOVA with Tukey’s multiple comparisons test for (F)–(I). The numbers in parentheses indicate the respective p values for statistical significance between the marked groups. *p < 0.05, **p < 0.01, ****p < 0.0001; NS, not significant. See also Figure S2.

