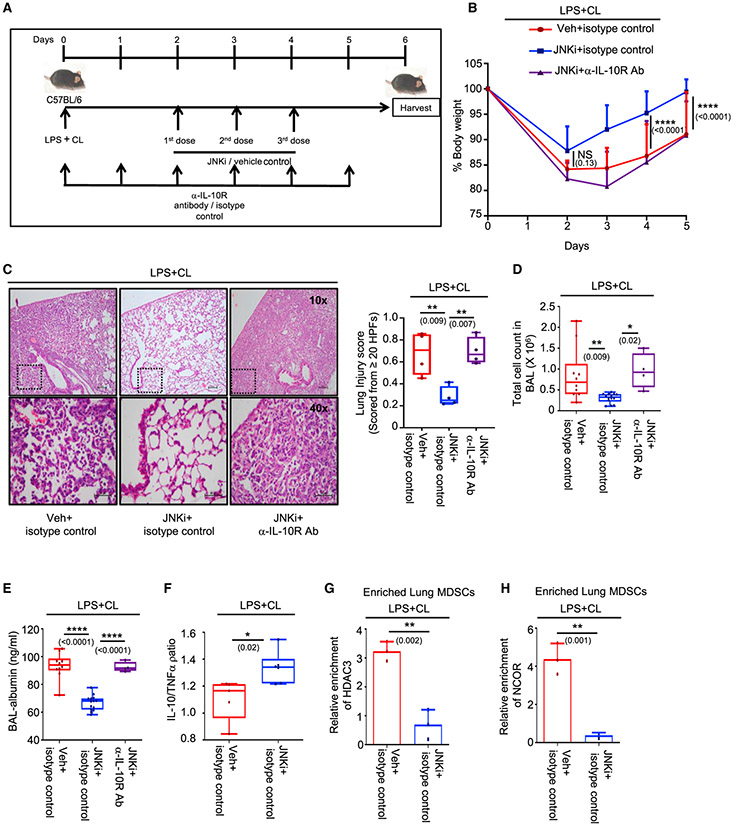
Figure 4. Blocking JNK resolves CL-mediated persistent lung inflammation by rescuing IL-10.
C57BL/6 mice of 8–10 weeks of age were treated i.t. with LPS + CL. After 48 h, mice were divided into 3 groups. The first group received appropriate isotype and vehicle (veh) controls, the second group was treated with JNK inhibitor (JNKi) (3 doses) + isotype control, and the third group received IL-10receptor-blocking antibody (6 doses) in conjugation with JNKi (3 doses) through tail vein injection. Experiments were conducted with 10 mice in the first group, 14 mice inthe second group, and 4 mice in the third group, except where mentioned. The data shown are representative of 2 independent experiments, except (B)–(E).
(A) Diagrammatic representation of the experimental design, including dosage schedule.
(B) Change in percentage of body weight monitored over 5 days. Significance and the respective p value mentioned in parentheses is indicative of the comparative analysis between vehicle + isotype control and JNKi + isotype control-administered mice.
(C) Lung pathology studied by H&E staining of lung tissue section (left panel). Lung injury score was calculated as described earlier (right panel). Four mice were considered in each group for quantification.
(D) Counts of infiltrating cells in BAL fluid.
(E) Albumin measured in BAL fluid by ELISA.
(F) Ratio of IL-10 and TNF-α expression level in lung tissue homogenate measured by ELISA. Five mice in the first group and 6 mice in the second group were considered for the analysis.
(G and H) Lung MDSCs were enriched from 3 mice in each group, and the ChIP assaywas performed on the IL-10 promoter to study the (G) HDAC3 and (H) NCOR recruitment.
(B)–(E) presents data pooled from 2 experiments, and (F)–(H) are data representative of 2 independent experiments. Data shown are means ± SDs. The hinges in the box and whisker graphs represent the interquartile distance and the whiskers represent the range. Each dot on the plots represents a biological replicate. Statistical significance was calculated using 2-way ANOVA with Tukey’s multiple comparisons test for (B), 1-way ANOVA with Tukey’s multiple comparisonstest for (C)–(E), and unpaired t test for (F)–(H). The numbers in parentheses indicate the respective p values for statistical significance between the marked groups. *p < 0.05, **p < 0.01, ****p < 0.0001; NS, not significant. See also Figure S4.

