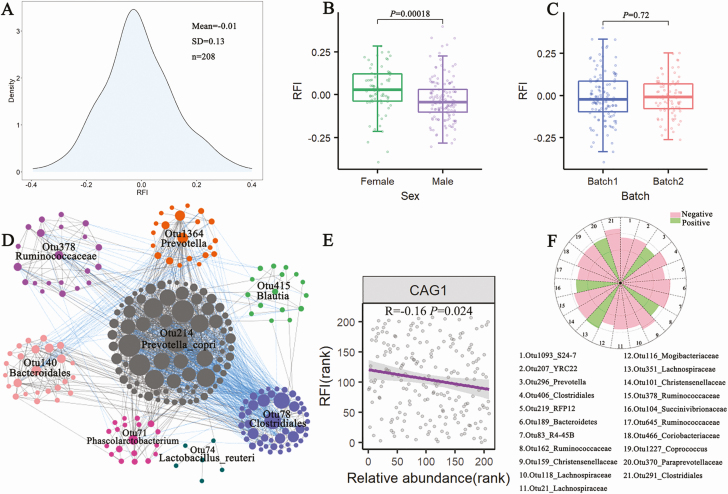
Figure 2.
The distribution and influencing factor of phenotypic values of the RFI, and the correlation between gut microbiota and the RFI based on 16S rRNA gene sequencing data. (A) The distribution of phenotypic values of the RFI in 208 experimental pigs. (B) and (C) The effects of sex (B) and batch (C) on phenotypic values of the RFI by Wilcox test. (D) CAG network of OTUs. The Spearman rank correlation was used. The OTUs with correlation coefficients > 0.5 are shown. Grey lines between nodes represent positive correlations, and blue lines refer to the negative correlations. The network was plotted by Cytoscape software (E) A negative correlation between CAG1 and the RFI values. (F) The 21 OTUs showing the tendency of correlation with the RFI by the 2-part model. The broken circles from the inside out indicate Z score = 1.0 and 4.0, respectively.

