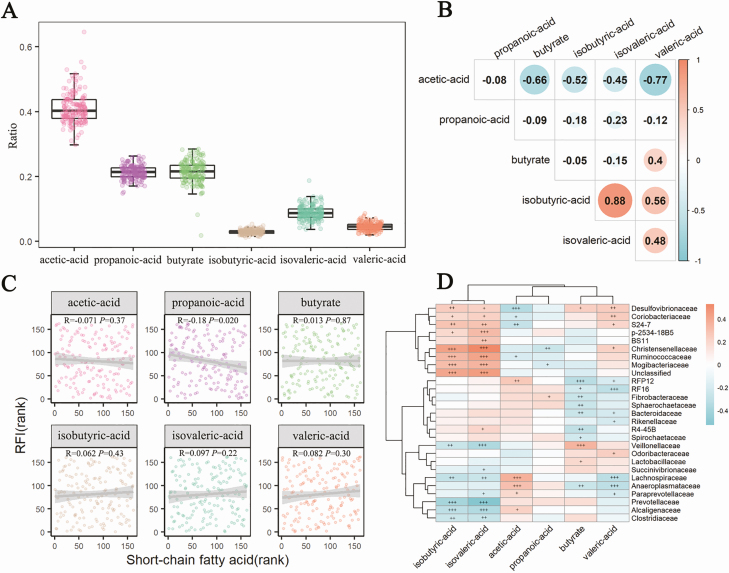
Figure 5.
The composition of SCFAs in feces samples and its association with the RFI. (A) The boxplot shows the distribution of 6 SCFAs. (B) Spearman rank correlation analysis between the ratio of 6 SCFAs and the RFI. (C) The Spearman rank correlations among 6 SCFAs. (D) The association of SCFAs with gut microbiota at the family level with the 16S rRNA gene sequencing data (+, P < 0.05, ++, P < 0.01, +++, P < 0.001). The associations were analyzed by Spearman rank correlation.

