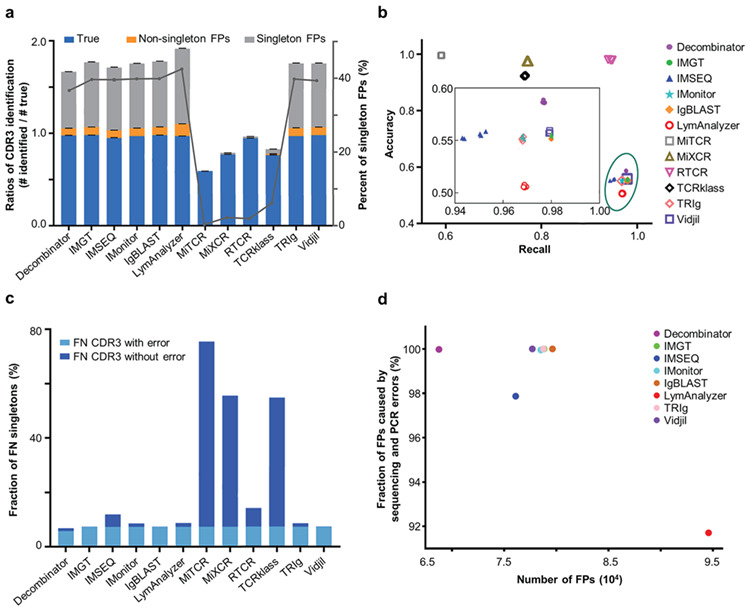
Figure 4.

CDR3 identification results. a. The bar graph shows the ratio of the reported number of unique CDR3 nucleotide sequences to the “True” number (Left Y axis). The ratio of CDR3 identification is calculated as the number of reported CDR3s divided by the number of true CDR3s. The sections of blue, light orange, and light grey indicate the proportion of “True” CDR3s, non-singleton false positives, and singleton false positives, respectively. The error bars indicate the standard deviations. The grey line shows the percentage of singleton false positives identified by each tool (Right Y axis). MiTCR, MiXCR, RTCR and TCRklass reported the fewest false-positive CDR3s. b. Recall and accuracy of the resulting repertoires generated by twelve tools for five replicates. Recall (X axis) is defined as the fraction of simulated CDR3s that were correctly identified. Accuracy is defined as the fraction of simulated CDR3s in the total identified ones (Y axis). c. The fraction of singletons among the false-negative CDR3s. The light blue bars at the bottom indicate the fraction of singleton CDR3s with either PCR or sequencing errors, and the darker blue bars stand for those singletons without errors. d. The fraction of false positives that were caused by PCR or HTS errors. The X axis indicates the number of false positives identified by different tools, and the Y axis shows the fraction of error-containing false positives.
