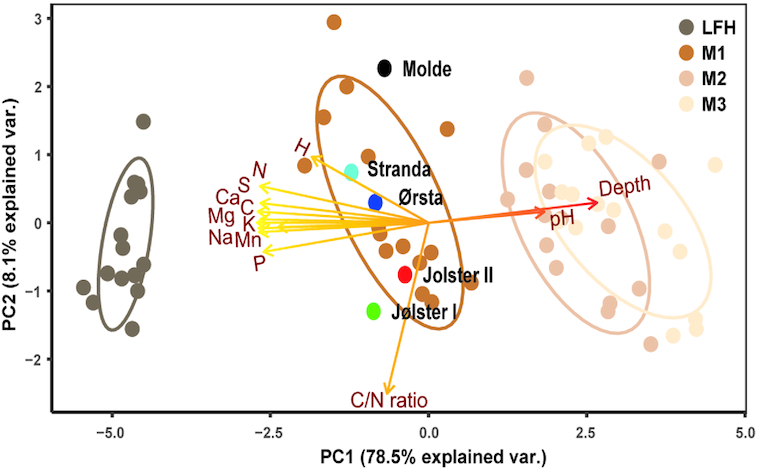
Figure 1.

Principal component analysis (PCA) of soil chemistry data along depth gradient. Samples were collected from five different location (Molde, Stranda, Ørsta, Jølster I and Jølster II), along forest floor (LFH) and three mineral soil layers: 0–5 cm (M1), 5–15 cm (M2), 15–30 cm (M3)). The first PC axis (PC1) score of each plot (shown with dark brown to light brown colored circles) was used as a ‘soil chemistry variability index’, as it reflects variation related to the soil nutrients. The second PC axis (PC2) score of each plot was considered as ‘location effect’ (it reflects variation in C: N ratio, related to sampling locations). Ellipses indicate 95% confidence intervals around centroids for each soil depth and black, skyblue, darkblue, red and green colored circles indicate centroid for each sampling location. Following soil chemistry data was used in the analysis: total carbon (C%), total nitrogen (N%), C/N ratio, soil pH and exchangeable elements H, P, Mn, Ca, Mg, Na, S and K.
