
Figure 5.
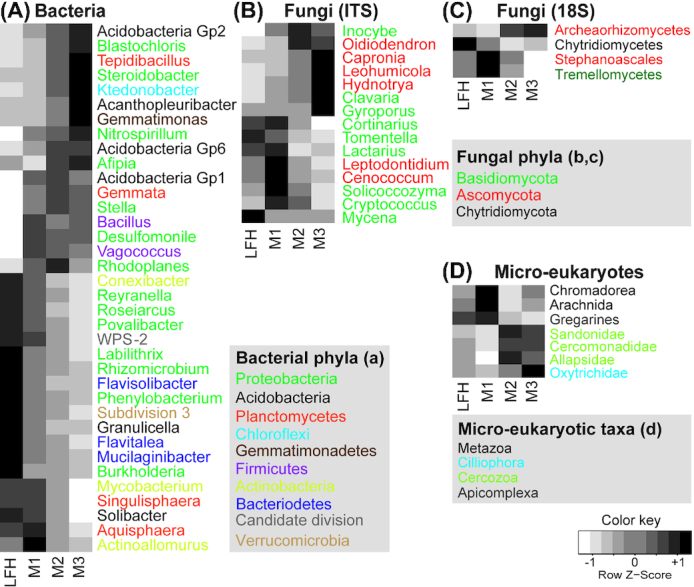
Hierarchical heatplots illustrating abundances distribution of the different microbial taxa (genus or class level). Plots for bacterial (A), fungal (ITS: B; 18S: C) and micro-eukaryotic (D) taxa with different soil depth (forest floor (LFH) and three mineral soil layers: 0–5 cm (M1), 5–15 cm (M2), and 15–30 cm (M3)) are shown here. All taxa shown in the plots are analysed using ANOVA and Tukey´s post-hoc test and differ significantly (P <<0.05i>) in abundances among soil depth. Colour gradients in the plots from white to grey to black indicates increasing dominance of the taxonomic groups in particular soil depth. Different color in bacterial and fungal genus name indicates respective phyla and in case of micro-eukaryotes color represent different taxa at higher taxonomic level. Different colors are used to indicate phyla for bacteria, fungi and micro-eukaryotes