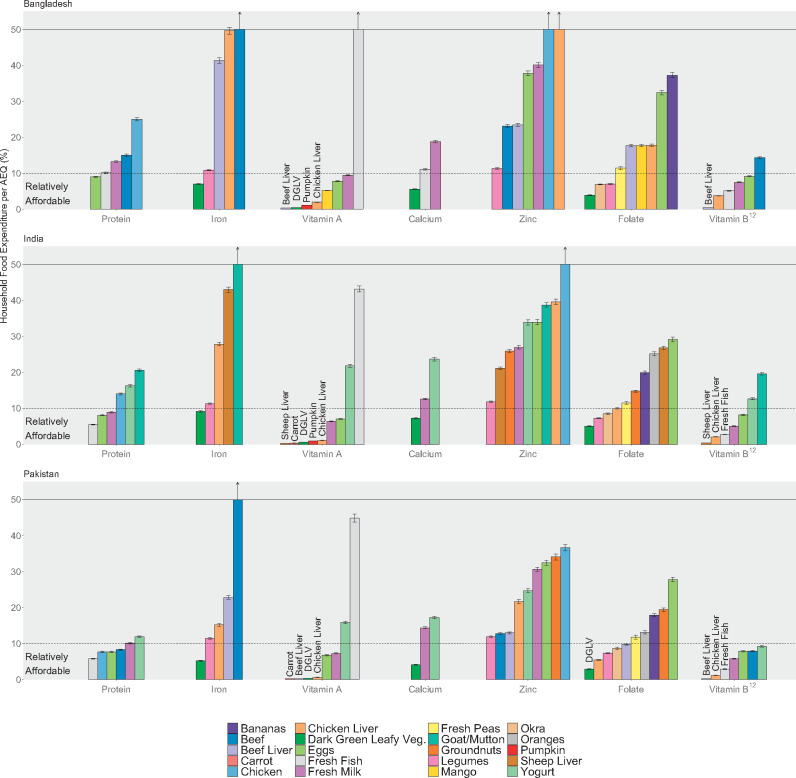
Figure 6.
Portion-size cost, as a share of total household food expenditure per adult equivalent (AEQ). Note: The y-axis was truncated at 50%, but the costs of some foods exceeded 50% of household food expenditure per AEQ; these foods are designated with vertical arrows indicating that the bar continues vertically beyond the scale of the graph. Sample sizes were 5813 households (Bangladesh), 10 868 households (India), and 5,202 households (Pakistan). Error bars represent 95%CIs. DGLV, dark-green leafy vegetables

