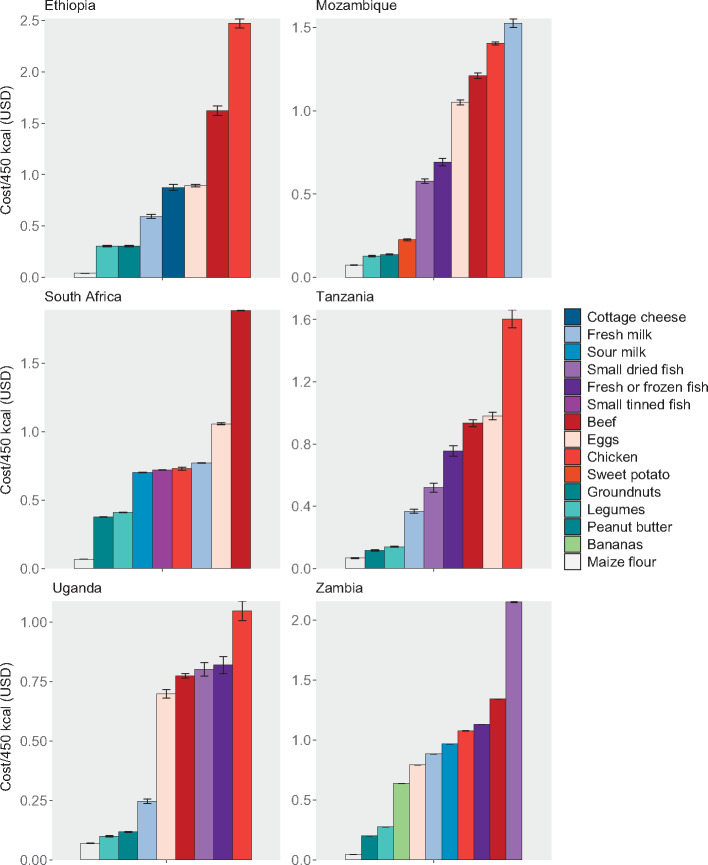
Figure 7.
Food cost per 450 kcal. Regional price data were not available for Zambia; thus, the costs shown here only incorporate small temporal changes in price over the survey period. Only households with children of complementary feeding age are shown, yielding sample sizes of 5808 households in Ethiopia, 9441 in Mozambique, 3303 in South Africa, 1062 in Tanzania, 728 in Uganda, and 2054 in Zambia. Error bars represent 95%CIs

