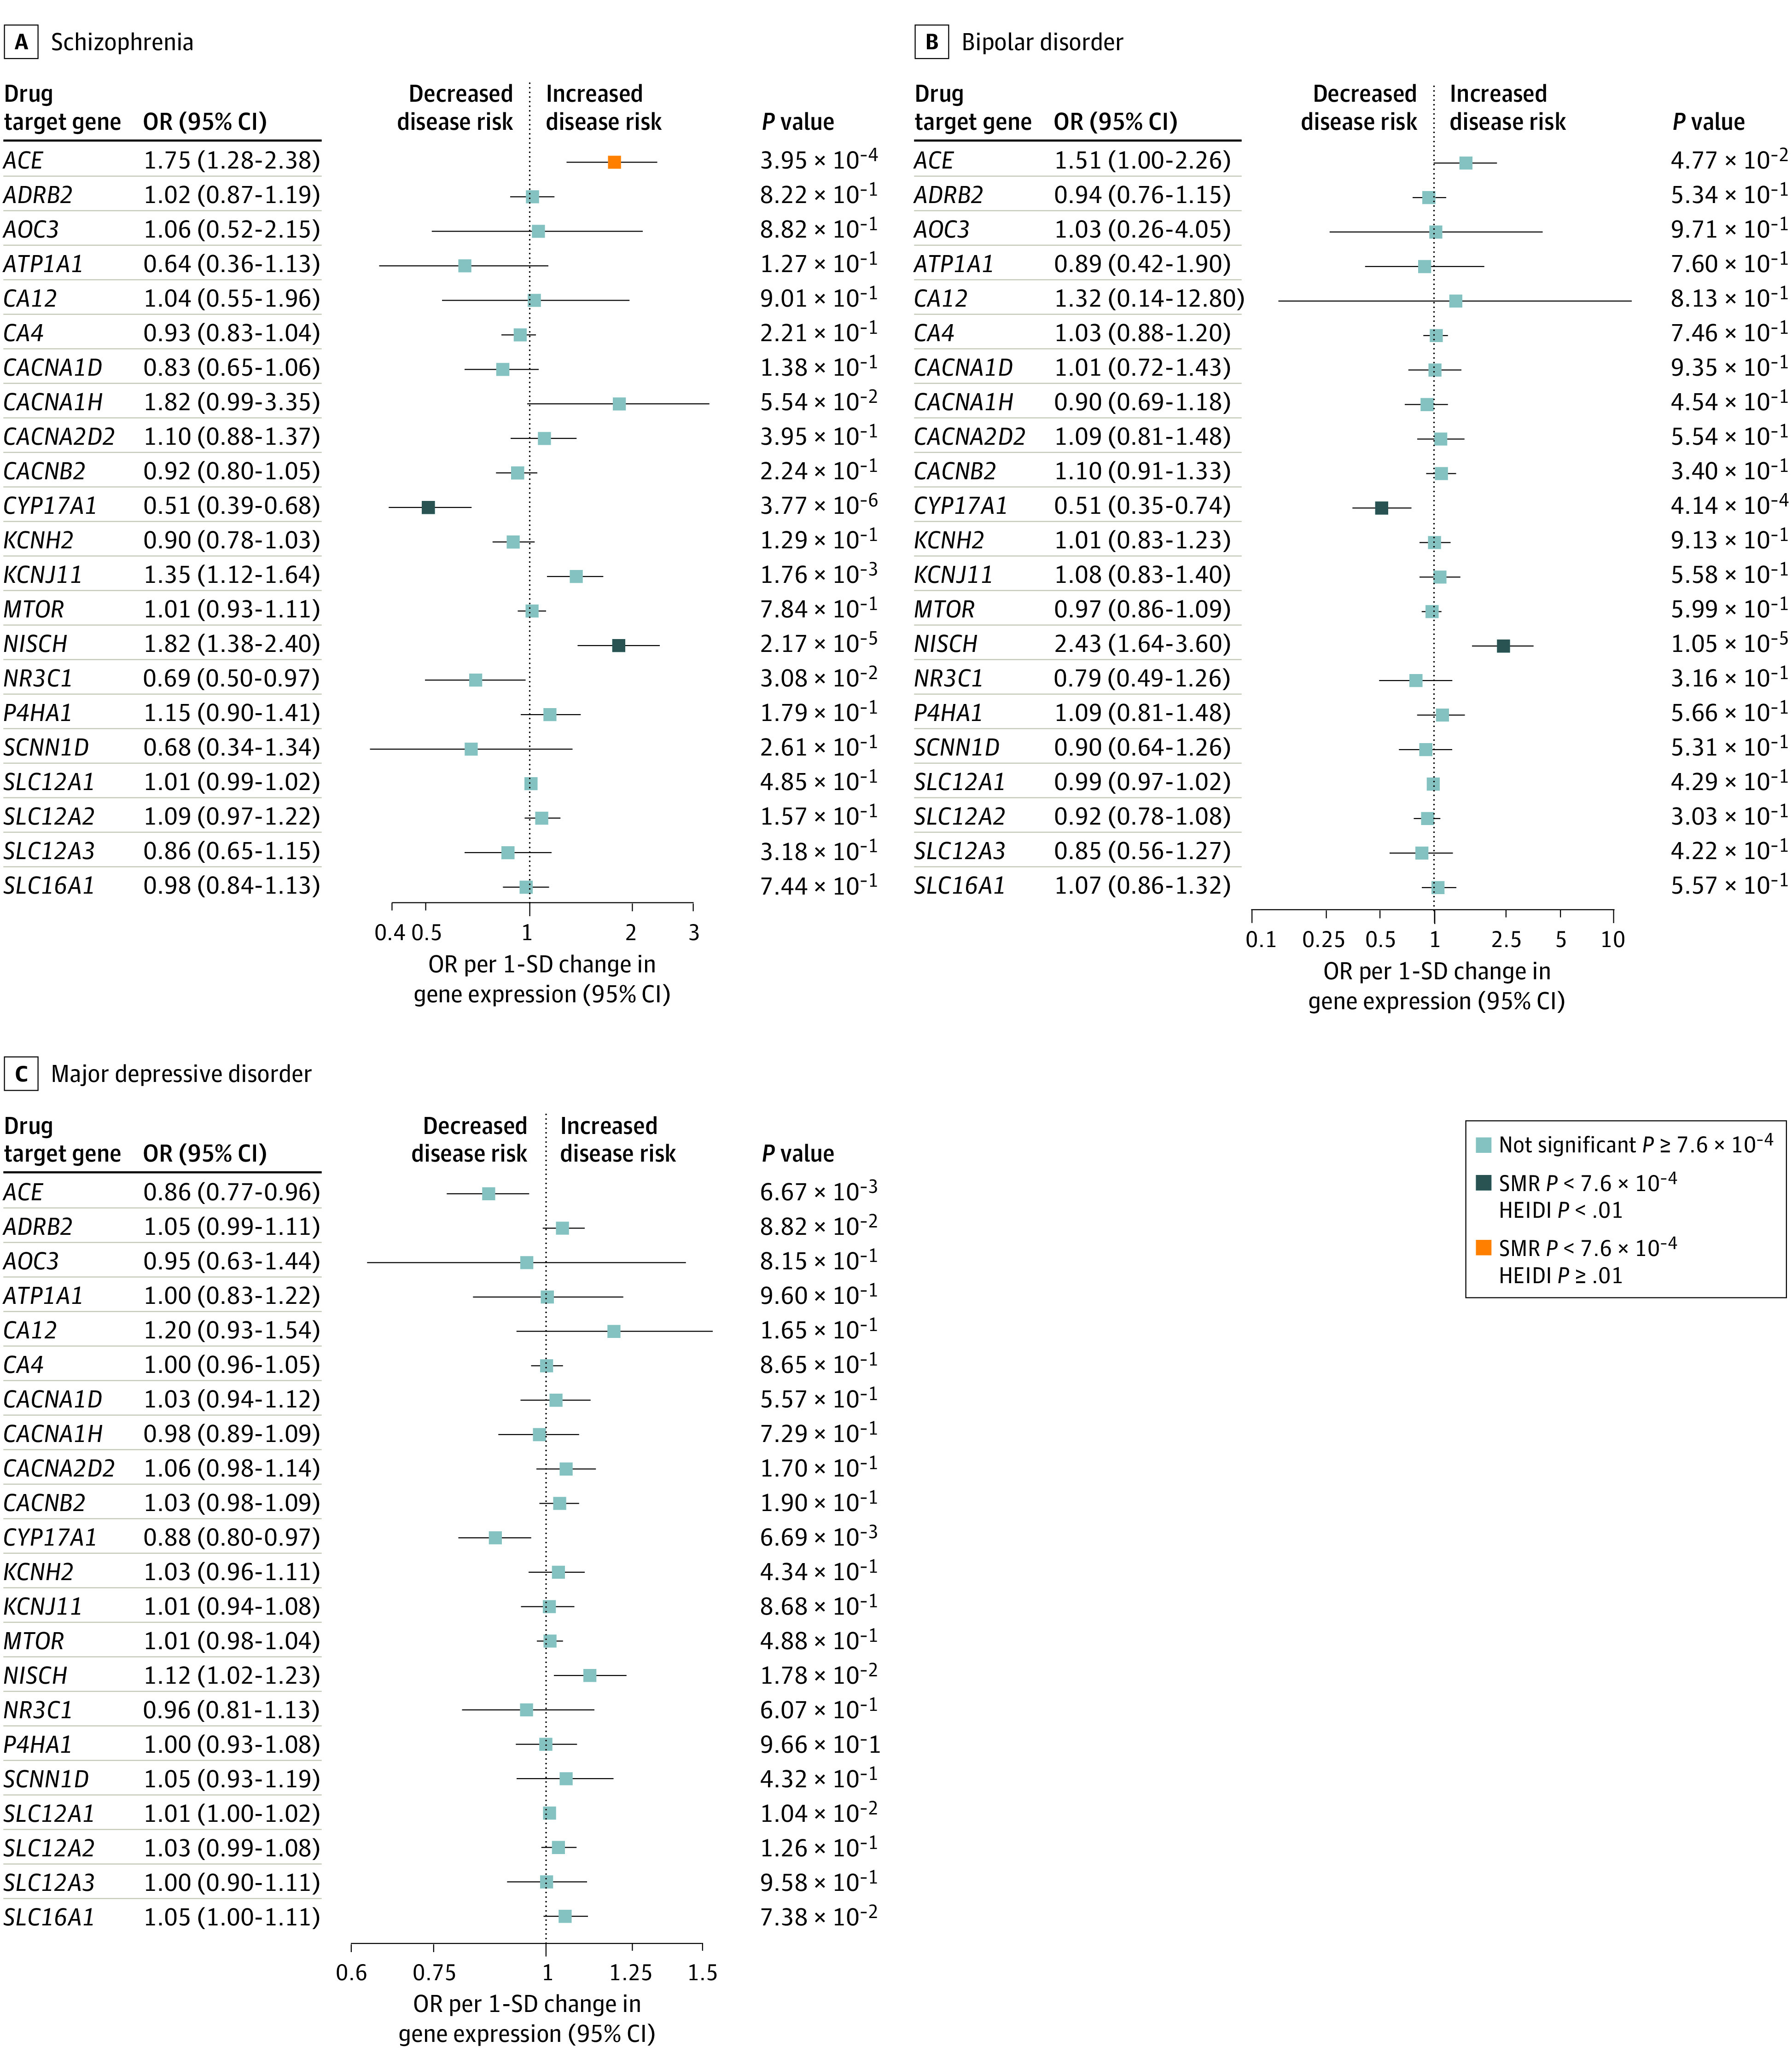
Figure 2. Association of Drug Target Gene Expression in Blood With Disease Risk.

Forest plot of the association between a 1-SD change in expression of 22 blood pressure–lowering drug target genes in blood with risk for schizophrenia (A), bipolar disorder (B), and major depressive disorder (C). Data are represented as odds ratios (ORs) with 95% CI (error bars). The direction of gene expression change reflects the systolic blood pressure–lowering association. Therefore, an OR of greater than 1.00 suggests an increased risk of disease associated with blood pressure–lowering drug treatment. Associations are statistically significant after correcting for multiple testing (22 genes x 3 phenotypes) and have a heterogeneity in dependent instrument (HEIDI) P ≥ .01, statistically significant after correcting for multiple testing but have a HEIDI P < .01 (indicating association likely due to linkage) or did not pass the multiple testing correction. SMR indicates summary-based mendelian randomization.
