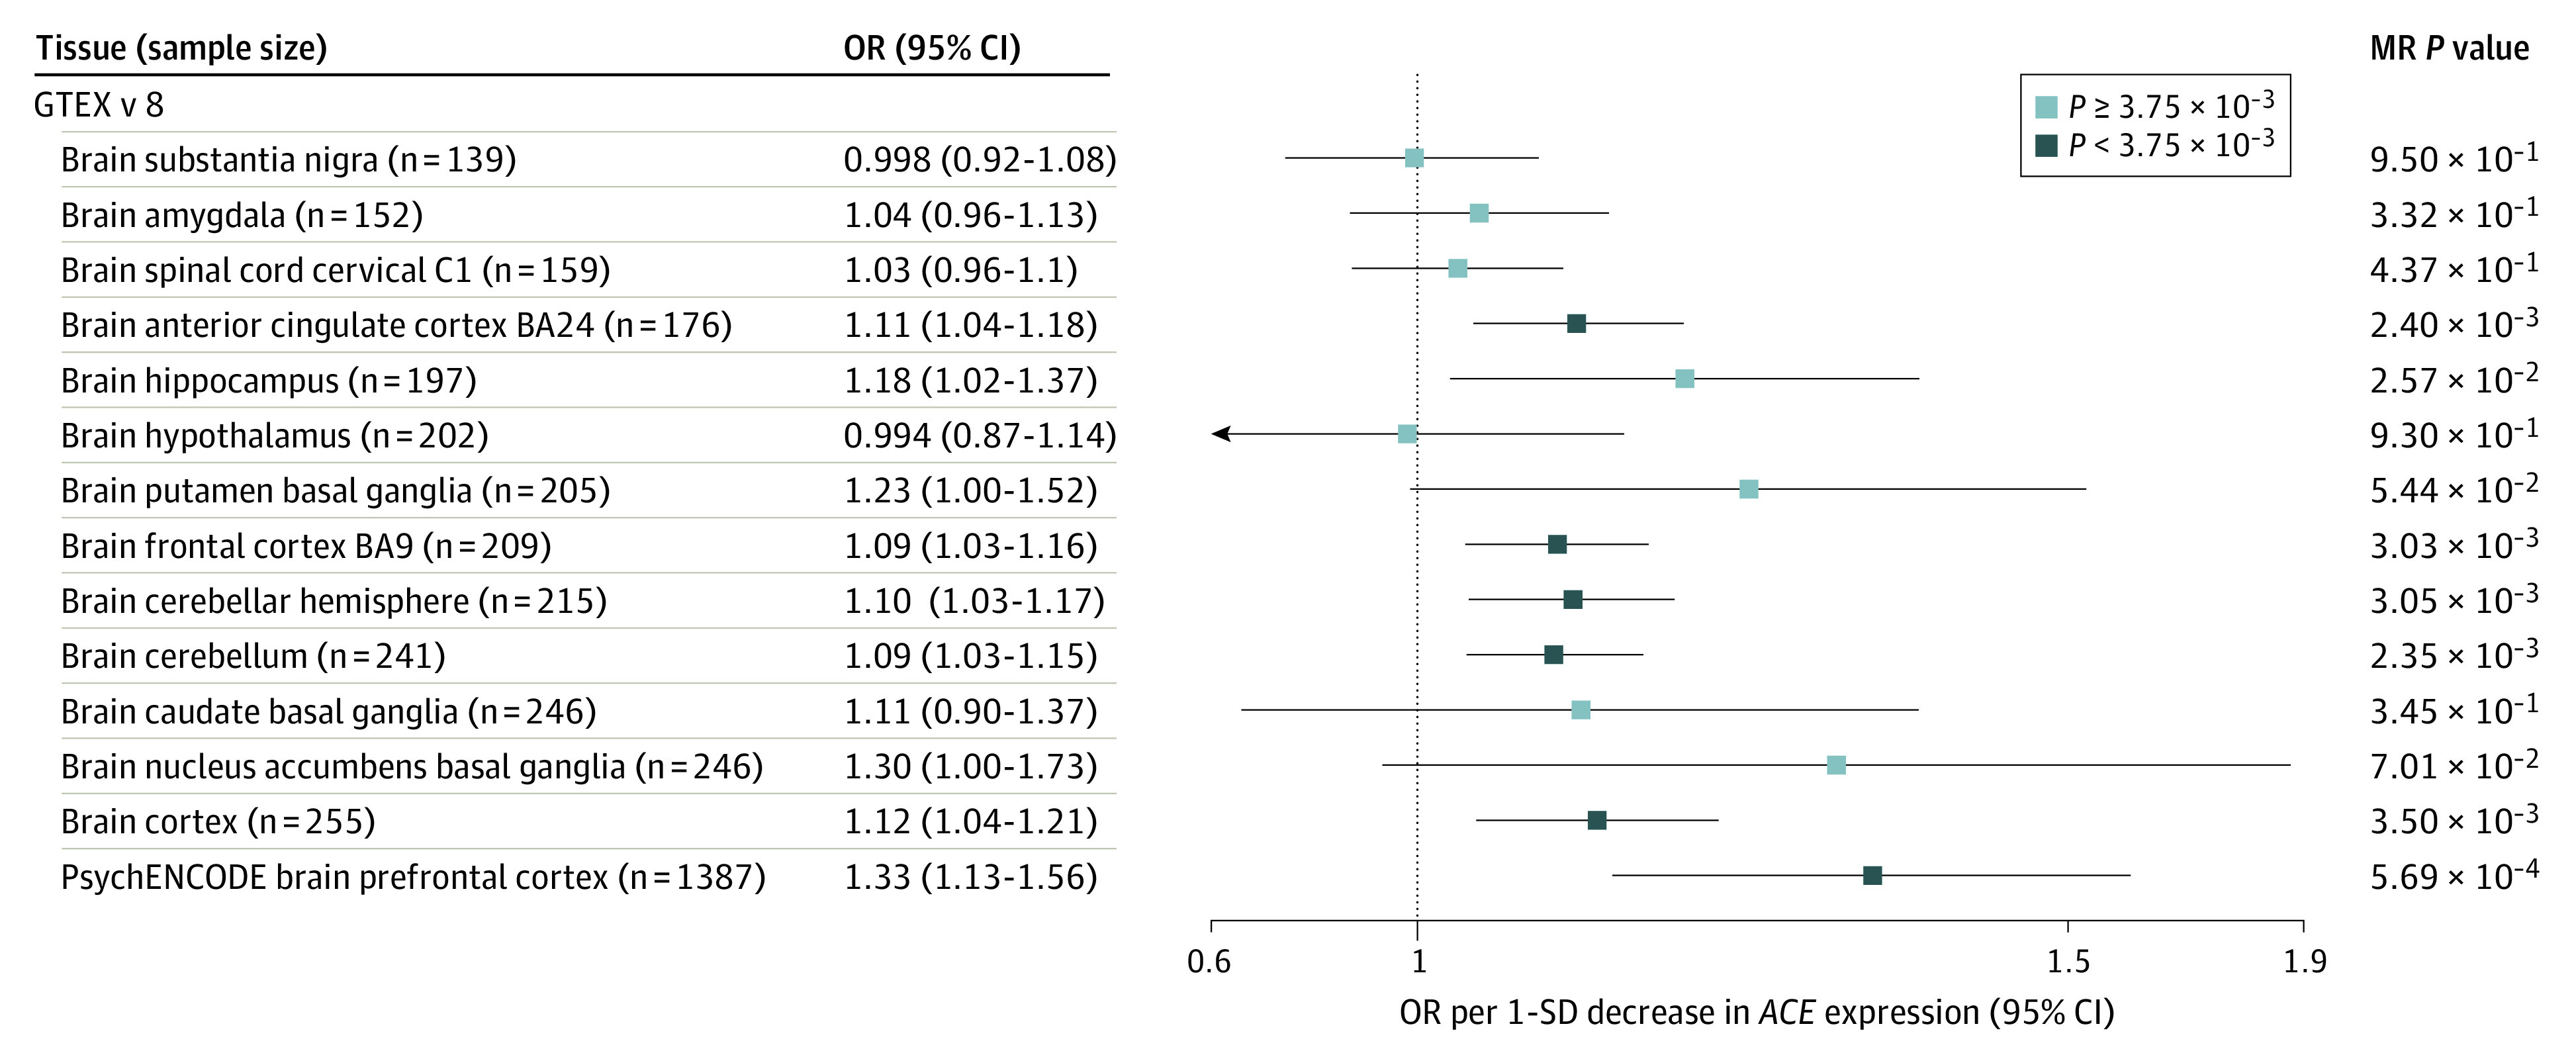
Figure 3. Mendelian Randomization (MR) Analysis of Angiotensin-Converting Enzyme (ACE) Gene Expression in Brain Tissue With Risk of Schizophrenia.

Forest plot showing the odds ratio (OR) and 95% CI (error bars) for schizophrenia risk per 1-SD decrease in ACE gene expression in different brain regions. Expression quantitative trait loci data were queried for 13 different brain regions from GTEX v8 and the prefrontal cortex region from PsychENCODE databases. Associations are statistically significant after correcting for 14 tests or did not pass the multiple testing correction. BA indicates Brodmann area.
