Figure 4.

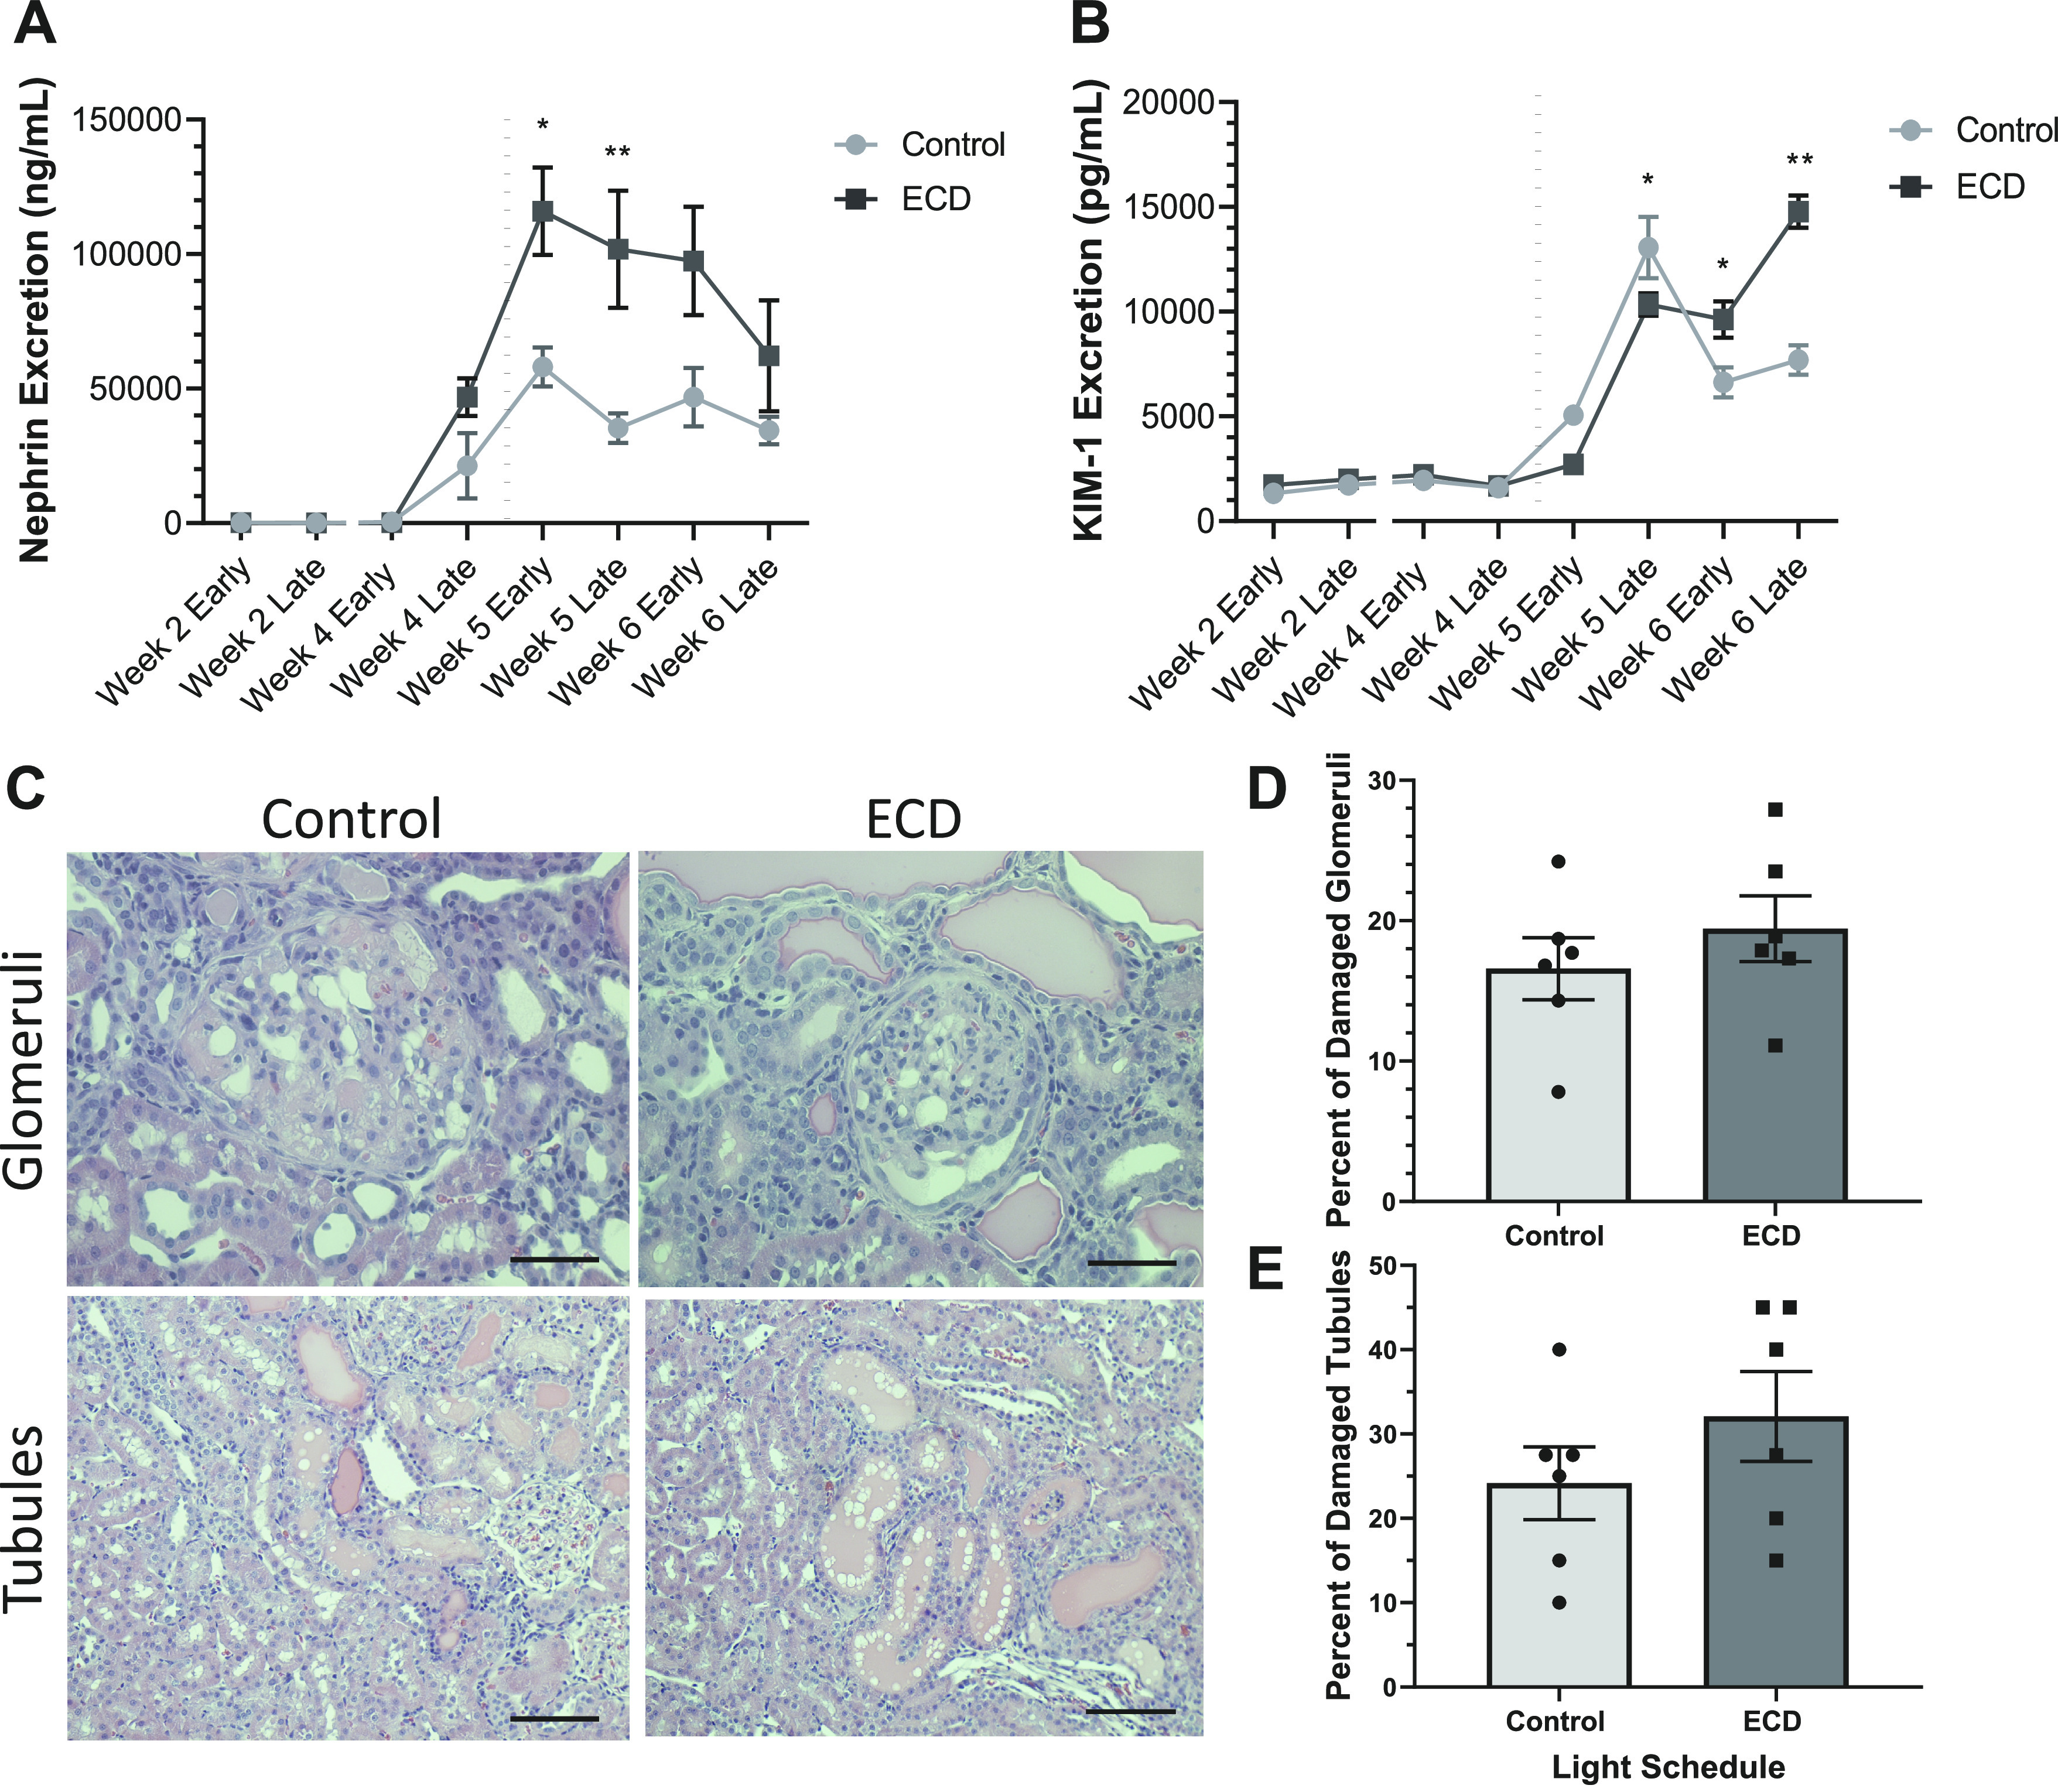
Renal injury markers. A: mean ± SE urinary nephrin excretion rate of male rats exposed to a control (n = 6) or ECD (n = 6) light schedule. B: mean ±SE urinary kidney injury molecule-1 (KIM-1) excretion rate. C: representative images showing the glomerular and tubular injury that was present in both control and ECD rats. Scale bars = 0.05 mm for top images and 0.1 mm for bottom images. D: individual and mean ± SE percentage of damaged glomeruli at the study completion. E: individual and mean ± SE percentage of damaged tubules. The black dotted line represents the replacement of regular drinking water with 1% Na+-supplemented drinking water. Two-way ANOVA, multiple comparisons for control vs. ECD: *P < 0.05 and **P < 0.01.
